Windows App
  MacOS (sillicon)
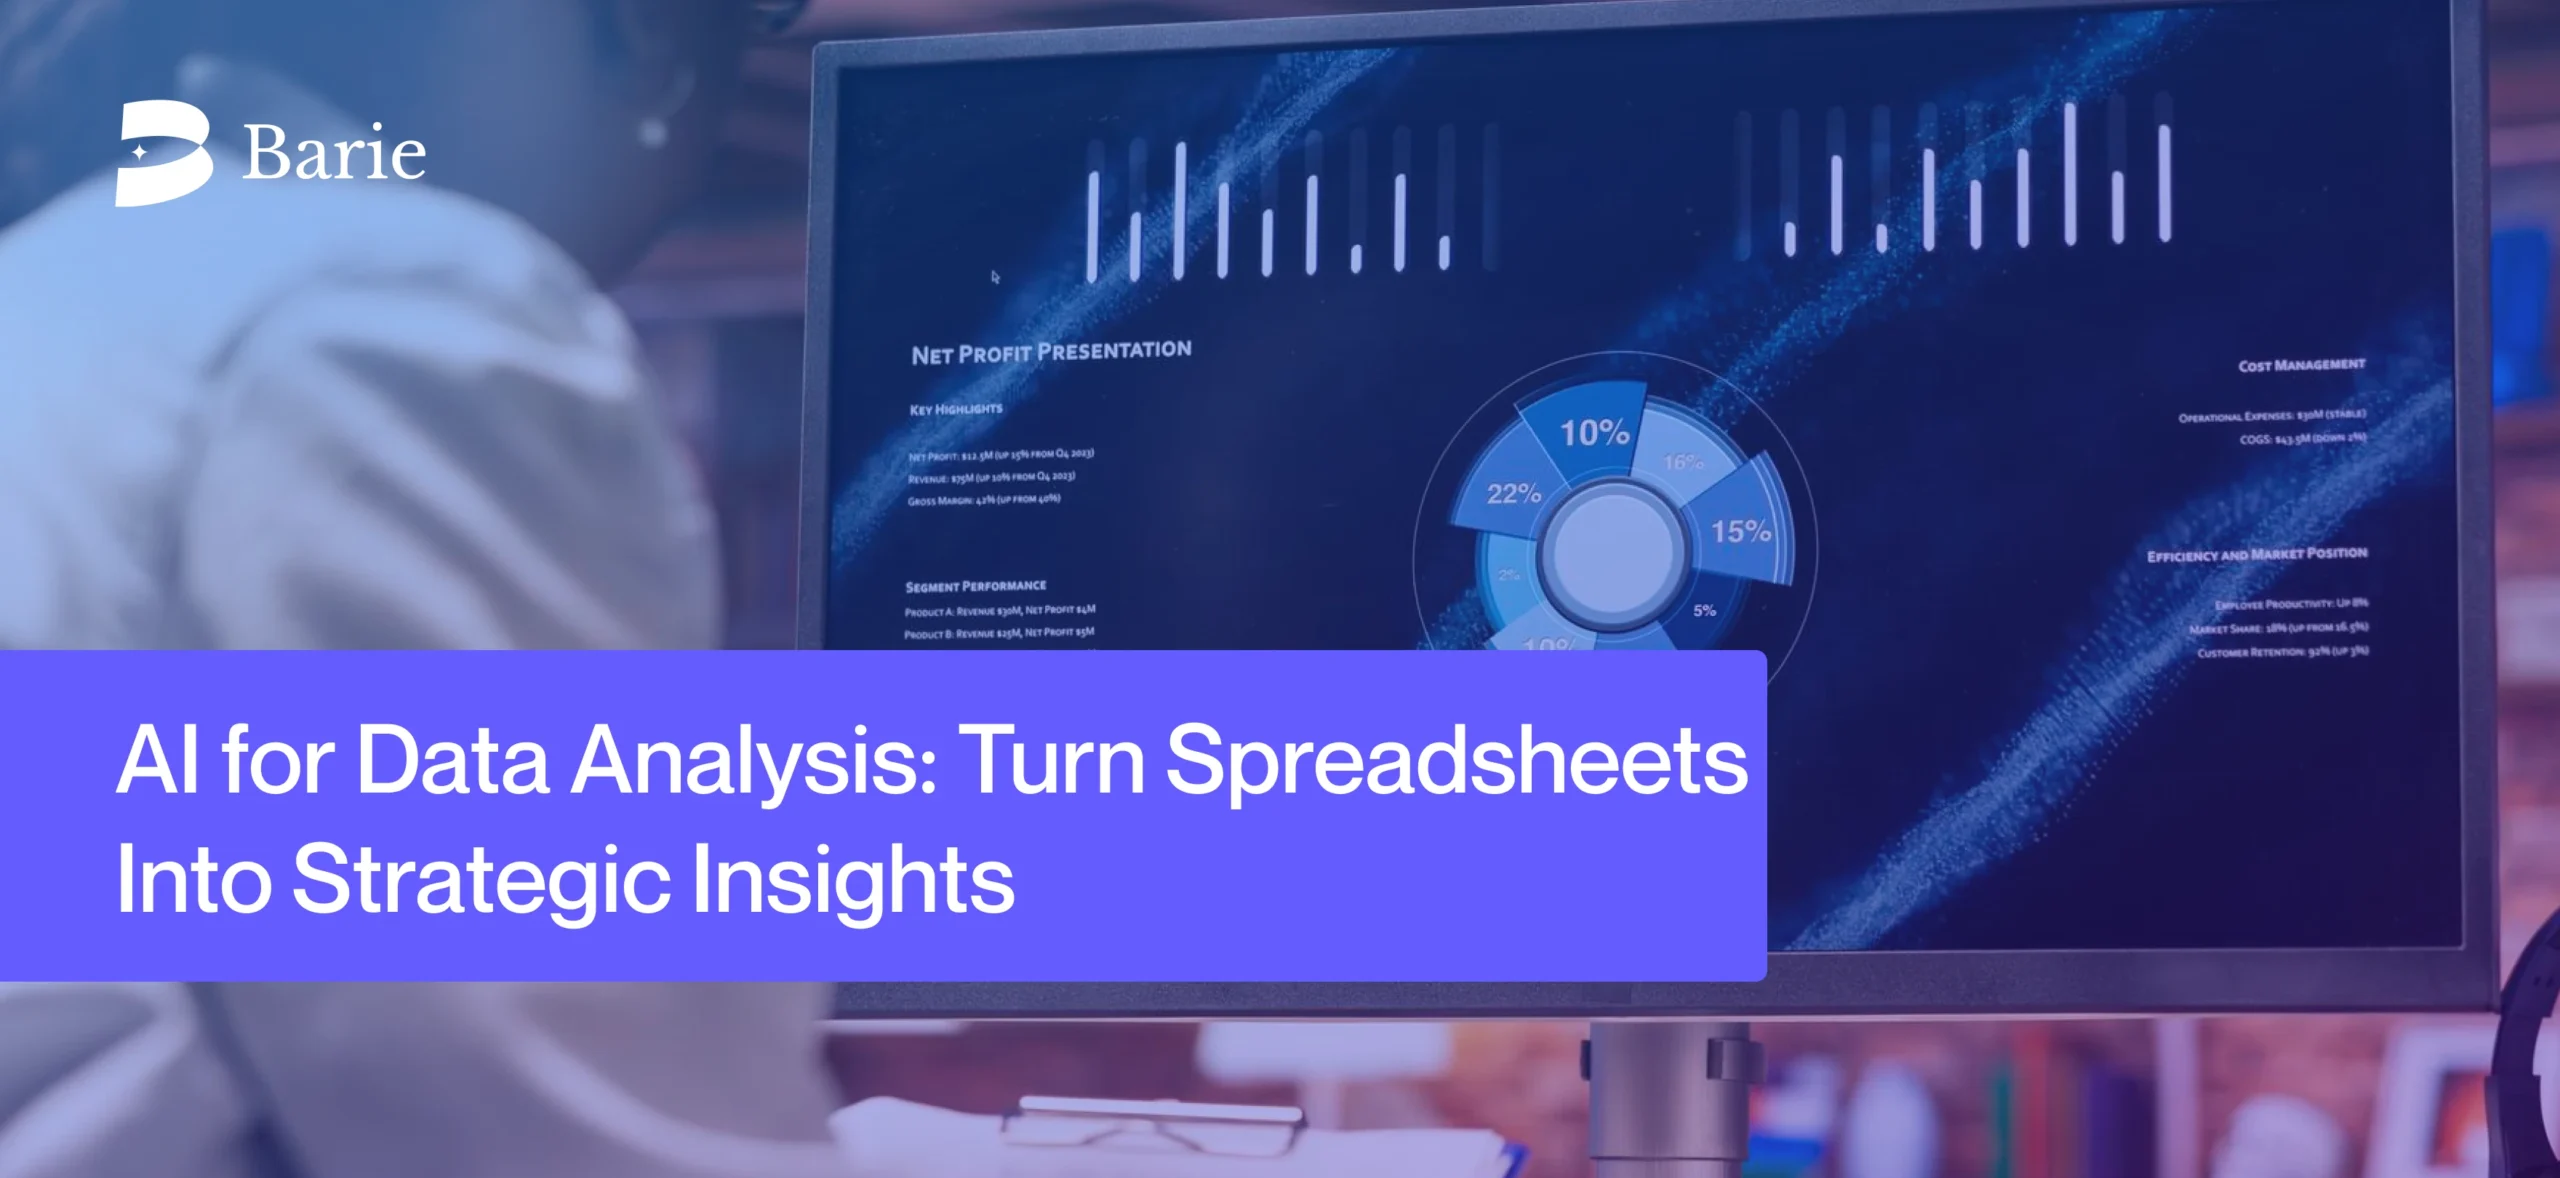

Your analyst spent three days in Excel cleaning a sales dataset. She built pivot tables, wrote formulas, and cross-referenced every column. Then she asked your AI tool to summarise the findings. It produced five confident paragraphs. Two of the trends it cited were not in the data. One figure was invented entirely. The formatting was immaculate.
That is the state of AI for data analysis in 2025. Confident outputs. Questionable sources. No way to tell the difference until the board meeting.
Why AI for Data Analysis Keeps Failing the People Who Need It Most
Most AI tools treat spreadsheet analysis like a text generation problem. You paste in data, you get a summary. The summary sounds right. Sometimes it is right. Often, it is shaped by what the model thinks the answer should look like, not by what the data actually says.
This matters because data-driven decisions at speed are now table stakes. Markets shift overnight. Competitor pricing changes on a Tuesday. A finance team that waits days to turn raw numbers into actionable insight is already behind. The promise of AI was supposed to close this gap, but for many teams, it has only added a new layer of risk.
The failure mode is predictable. A user uploads a CSV, asks for trends, and receives a narrative built from pattern-matching against training data rather than rigorous analysis of the actual file. The numbers look plausible. The conclusions feel coherent. And the analyst trusts them because the alternative, redoing the work manually, costs time no one has.
What Real AI Data Analysis Actually Requires
The gap is not between fast and slow. The gap is between analysis that cites live, traceable sources and analysis that guesses convincingly. Genuine AI for data analysis does not answer based on what it already knows. It researches, cross-references, and surfaces the reasoning behind every output.
That means three things: the ability to pull live context from the web when the data needs enriching, the capacity to run parallel analytical tasks without bottlenecking on one thread, and source-cited outputs that let a human trace every claim back to its origin. Without these, you are not doing analysis. You are reading a very confident hallucination.
Standard AI tools handle one of those three, at best. They summarise. They visualise. They do not verify. And in data analysis, unverified insight is liability dressed up as strategy.
How Barie Approaches AI for Data Analysis Differently
Barie was not built to summarise spreadsheets. Every architecture decision came from that specific frustration: anti-hallucination is not a feature Barie added. It is the reason Barie exists.
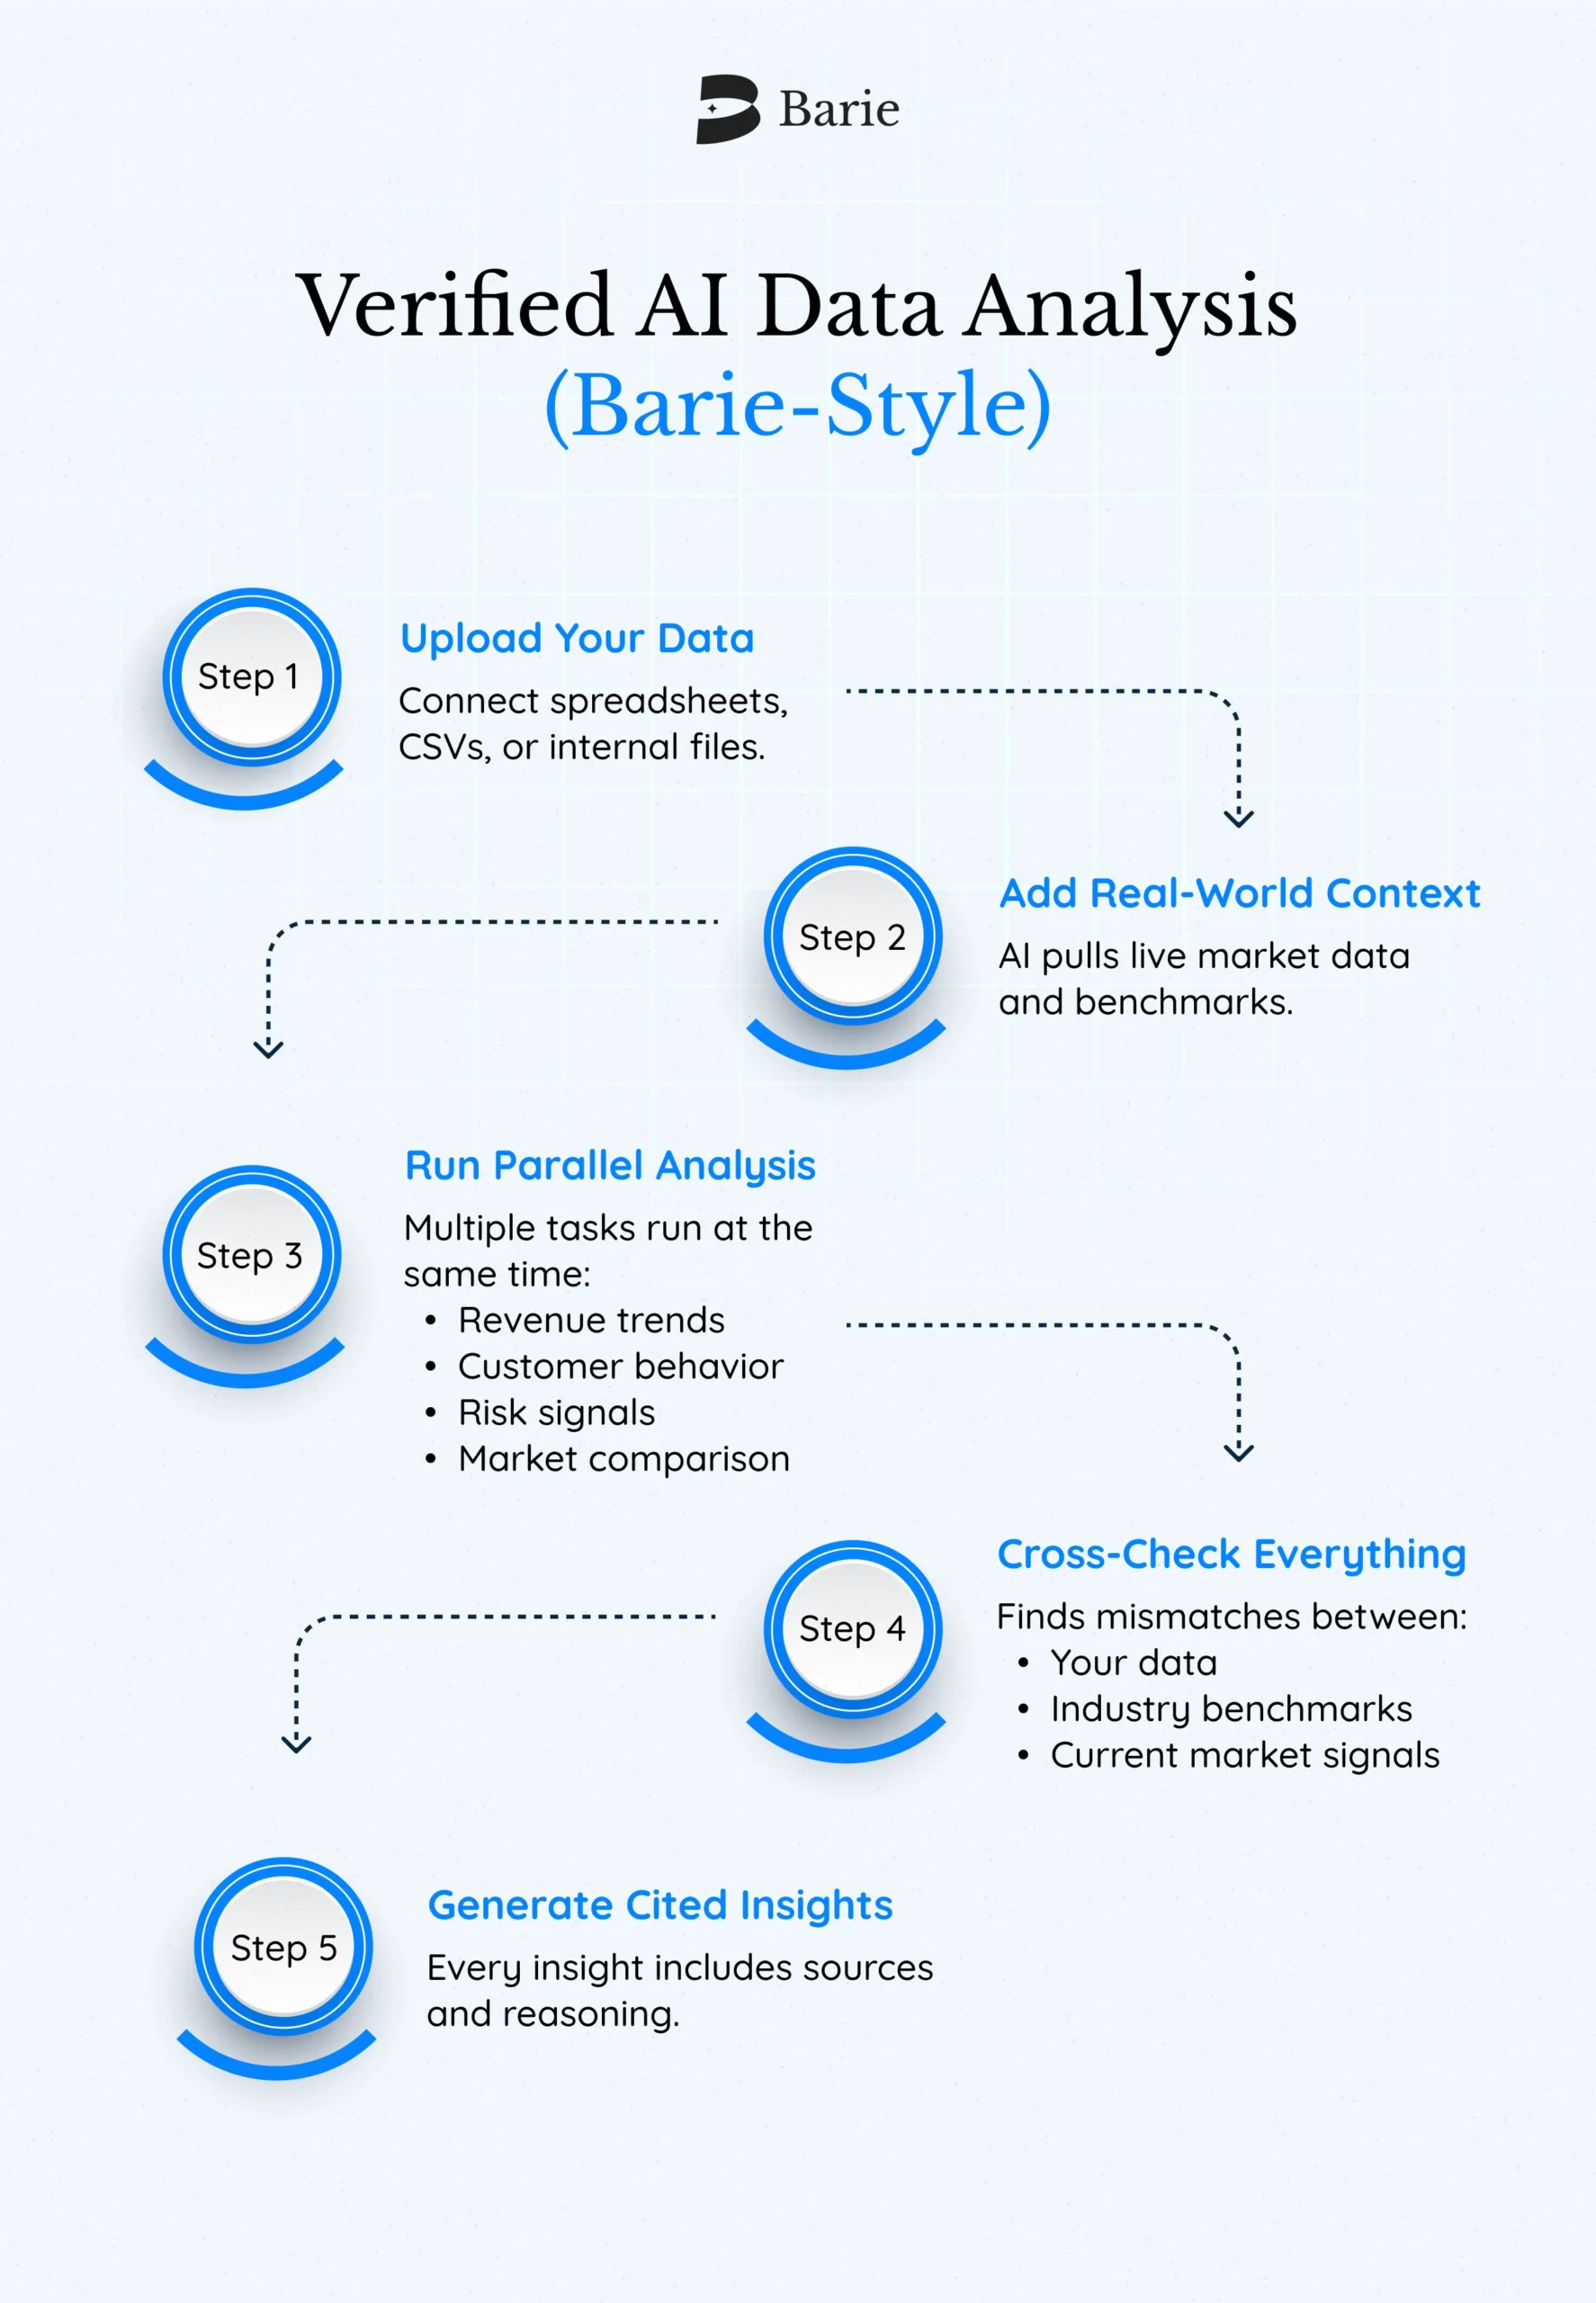
When a business analyst asks Barie to analyze market performance data, Barie does not answer with training data. It uses Deep Research to pull live web context, cross-referencing your internal numbers against current industry benchmarks, competitor pricing, and sector-specific trends. The output is structured, presentation-ready, and fully cited. Every claim has a traceable source. Every insight is grounded in something real.
Barie also runs parallel subtasks simultaneously. When you need a five-part analysis, revenue trends, cohort breakdown, churn signals, competitive positioning, and forward projections, Barie does not work through them sequentially. It fires all five at once, synthesizes the outputs, and delivers a unified report. What would take an analyst two days takes Barie one focused session.
Turning Spreadsheet Data Into Business Intelligence: A Real Workflow
Here is what this looks like in practice. A SaaS operations lead uploads six months of subscription data and asks Barie to identify churn risk signals, benchmark the retention rate against the industry, and flag which customer segments are underperforming.
Barie uses Connectors to pull current industry retention benchmarks directly from live sources. It cross-references the uploaded data against those benchmarks in parallel. It identifies three underperforming segments, surfaces the churn pattern across each one, and compares the company’s 68% retention rate against a live industry median. The output arrives as a structured brief with source citations and a recommended action per segment.
That is not a dashboard add-on. That is an analyst-level output delivered without an analyst. The operations lead does not get a chart. She gets a decision brief she can walk into a board meeting with, sourced, structured, and actionable. Nothing in that output was invented.
AI Business Intelligence: What Changes When the Research Is Live
The difference between static AI analysis and live AI data analysis shows up most clearly when decisions depend on context that changes daily. A pricing model built on last quarter’s competitor data is already wrong. A market sizing report that cannot cross-reference current news is a historical document, not a strategic tool.
Barie’s Web Search capability means that when your data needs context, and it always does, Barie finds it in real time. A financial analyst running a market risk analysis gets outputs that reference current regulatory filings, recent earnings calls, and sector-specific volatility data, not a synthesised guess from a frozen training set. The difference in decision quality is not marginal. It is the difference between informed strategy and educated guessing.
For teams managing complex data analysis workflows across multiple tools, Barie’s Connectors close the loop between research and execution. One prompt can pull data from a connected source, run a comparative analysis, and push the structured output where it needs to go. No manual export. No copy-pasting between tabs. Just execution.
The Accuracy Standard That Separates Barie From Standard AI Analytics Tools
Barie aces the GAIA Level 3 benchmark, the standard that tests whether an AI can complete genuinely complex, multi-step tasks reliably. Most AI tools do not publish GAIA scores. The ones that do rarely reach Level 3. Barie is at 90% accuracy across 1M+ hallucination-free chats in 25+ industries. That is not a marketing claim. It is a verifiable performance record.
For data analysis specifically, this matters more than almost any other use case. A wrong answer in a creative brief is annoying. A wrong trend in a financial analysis shapes investment decisions, headcount calls, and pricing strategy. The tolerance for hallucination in data work is zero. Barie was built with that tolerance in mind.
Stop Analyzing in the Dark
Most teams are not bad at data analysis. They are bad at getting reliable insight fast enough to act on it. The spreadsheet is not the bottleneck. The gap between raw data and a decision-ready brief is where strategy dies.
Barie closes that gap, not by generating summaries that feel right, but by researching, verifying, and delivering outputs you can actually trust. If your team is still spending days turning data into insight, that is worth fixing today.
Explore Barie for free and power your first workflows with 900 credits.