How Barie builds a diversity benchmarking report comparing your workforce data against published industry averages — current, sourced benchmarks, not outdated figures
Barie researches live industry diversity reports, public company EEO-1 disclosures and D&I reports, and peer benchmarking surveys published in 2025 and 2026. It builds a structured comparison of your workforce diversity metrics against current, sourced industry averages — so the gaps and achievements you report to leadership and the board reflect where your industry actually is today, not where it was in a 2022 survey.
Why diversity benchmarking against outdated industry averages produces misleading gap analysis
An HR leader preparing a quarterly diversity report pulls industry benchmark data from a McKinsey Women in the Workplace report published in 2022 and a SHRM diversity survey from 2023. She compares her company\’s representation figures against these benchmarks and concludes that the company is above average on gender representation in engineering and at average on underrepresented minority representation in leadership. The board approves continued resourcing at current levels.
What the 2022 and 2023 benchmarks cannot tell her is that the tech sector\’s diversity statistics shifted materially in 2024 and 2025 following the publicised DEI programme rollbacks at several major tech companies. The industry average for underrepresented minority representation in tech leadership that her company is “at average on” has changed. Companies that were previously leading have scaled back programmes, changing the distribution. Her company may now be above average on the current 2025 benchmarks without having changed anything. Or the current benchmark may be higher and the gap she is managing has widened. Without current data she cannot know which is true.
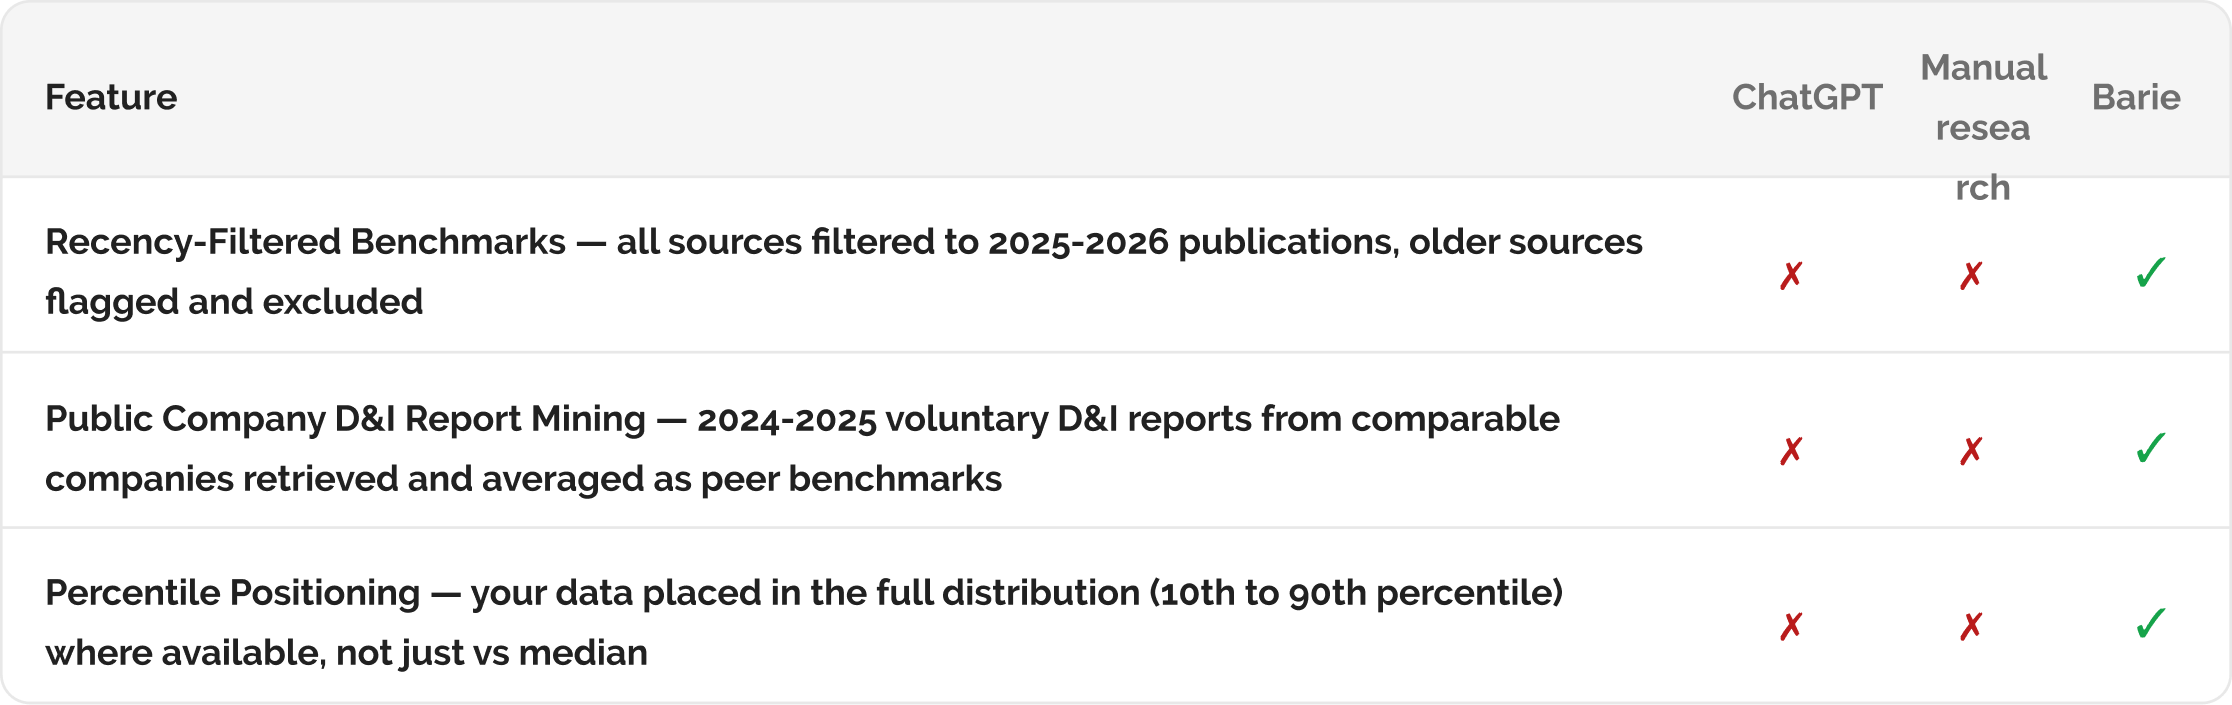
Barie retrieves diversity benchmarks from reports published in 2025 and 2026 — filtered for recency before any comparison is made: Every industry average in the benchmarking output has a publication date. The report identifies when the benchmark was set, what company population it covers, and any methodology differences that affect comparability. Your diversity data is compared against the current market, not the market as it was documented before the industry landscape shifted.
Your prompt
Task prompt
“Build a diversity benchmarking report for our industry, compare our workforce data against published industry averages.”
1: Research Stack Activated
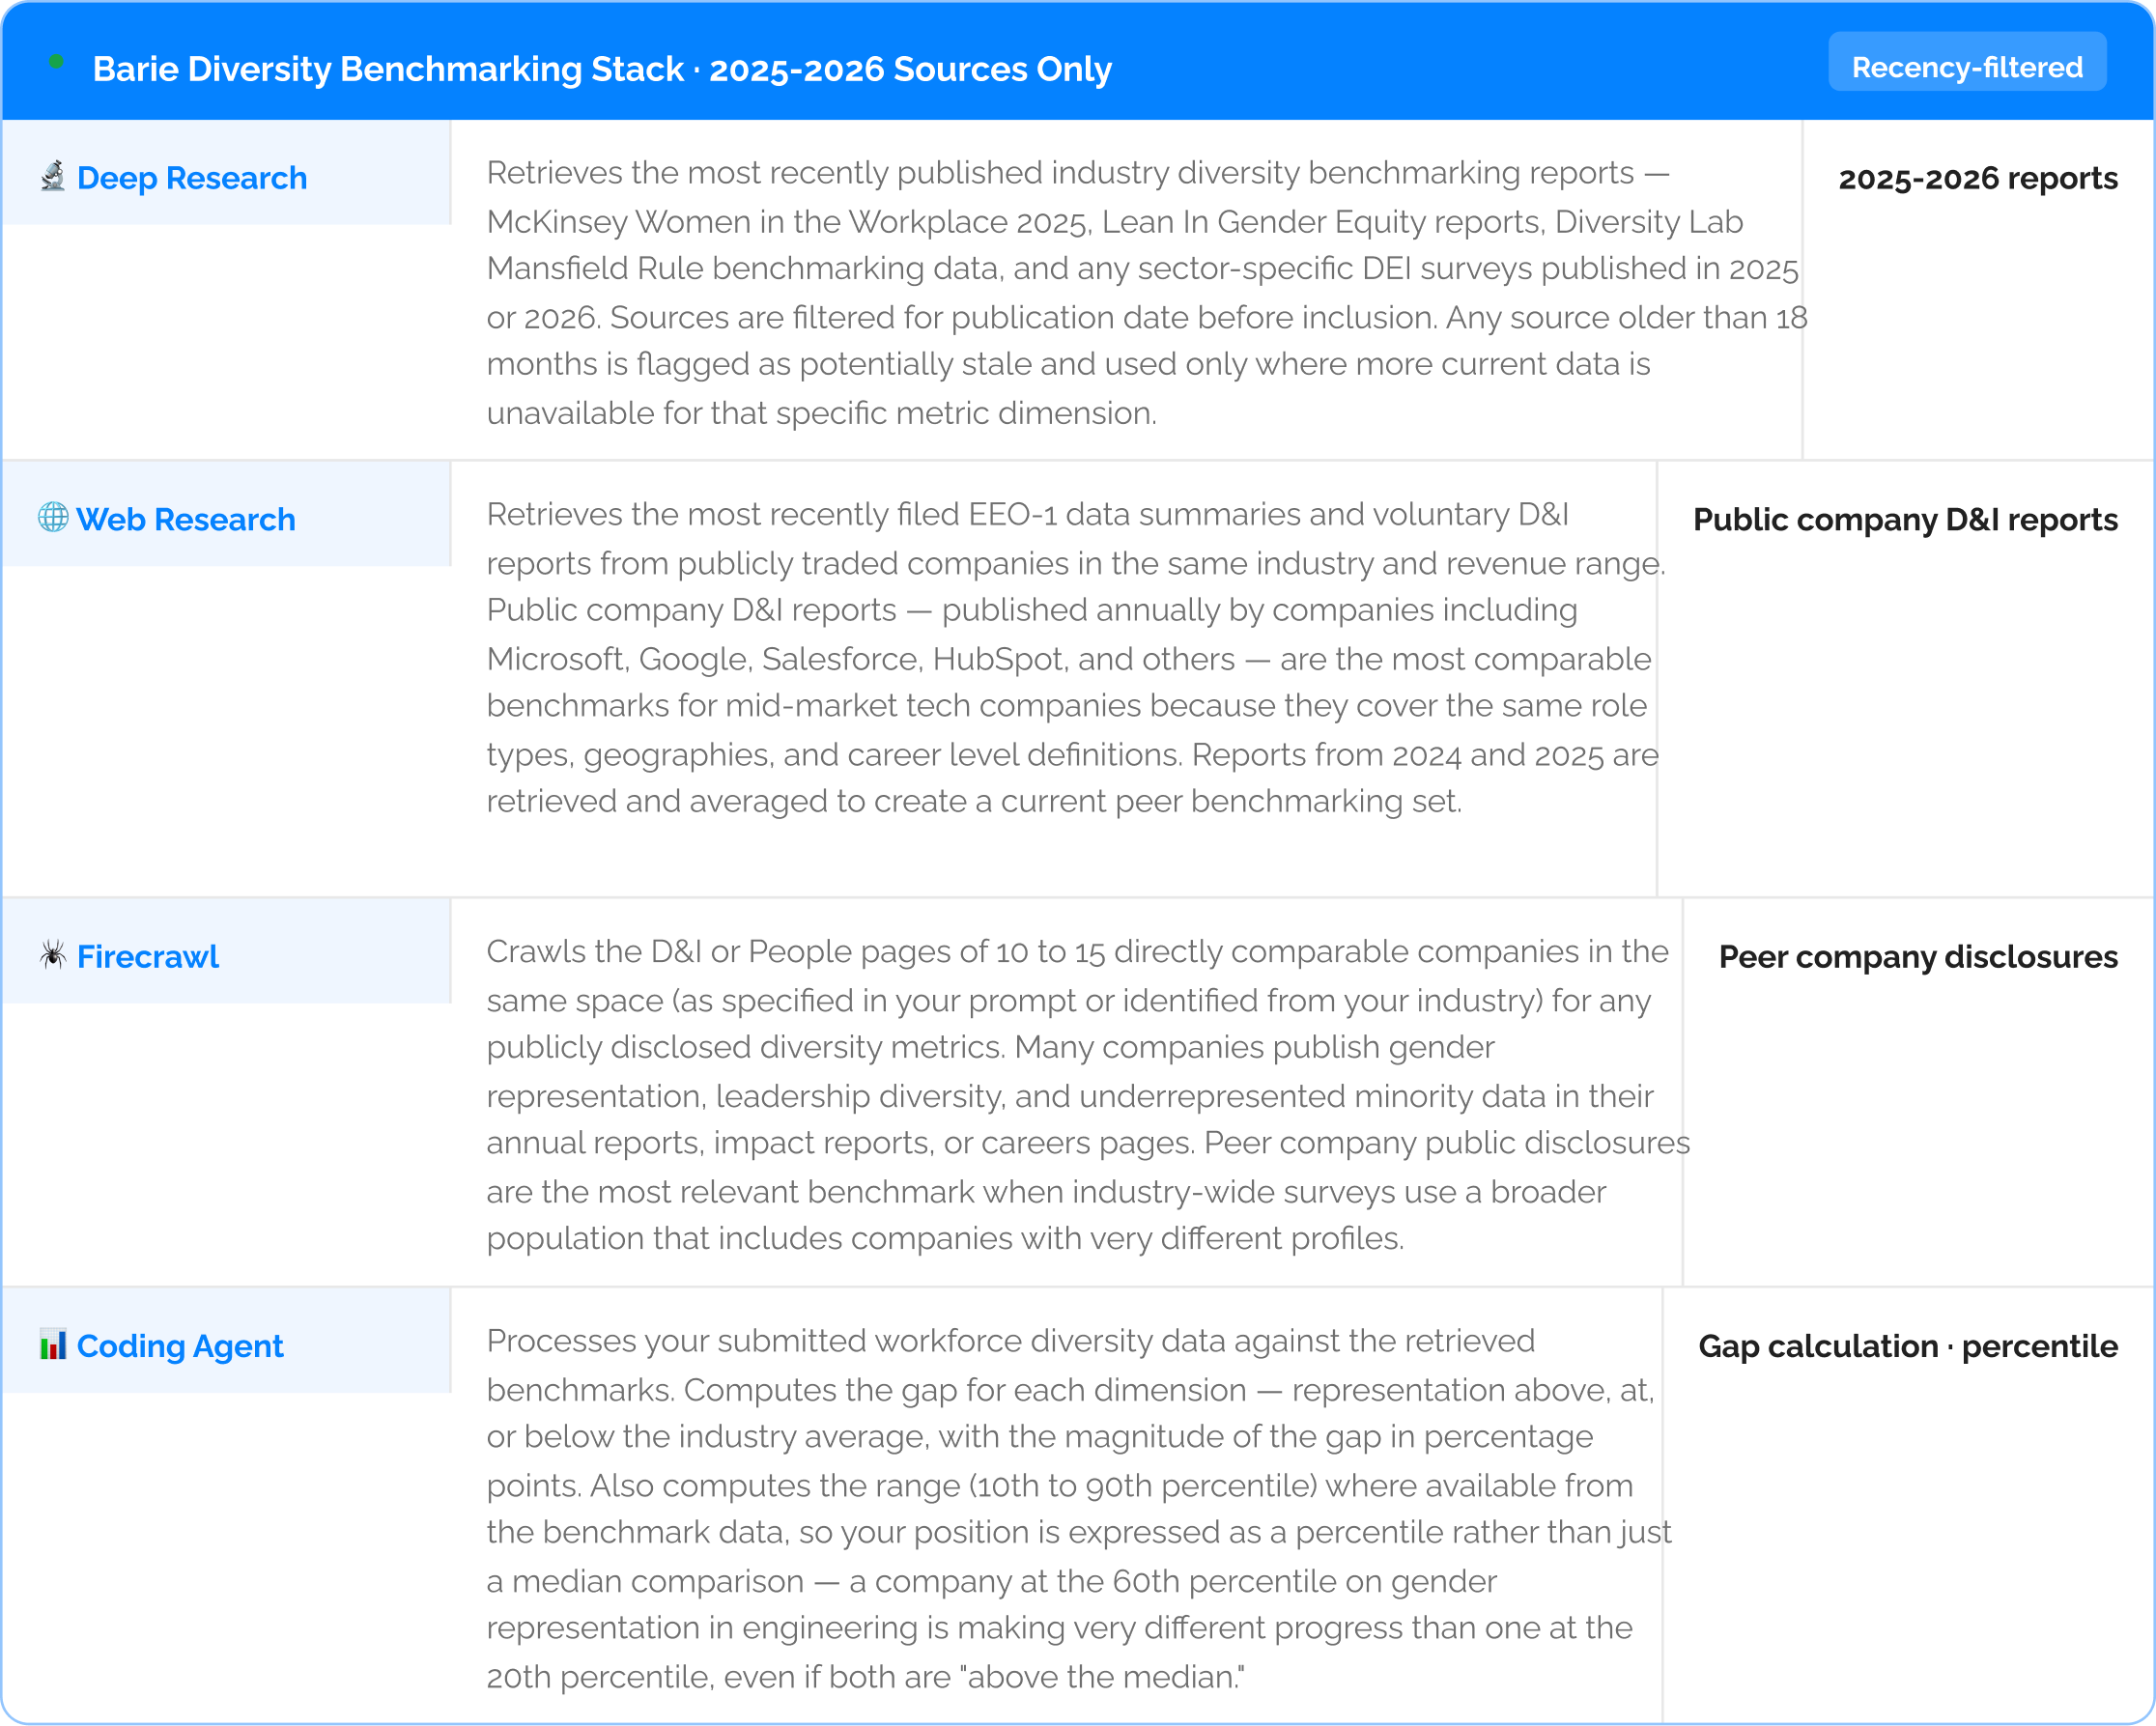
Step 1: Research stack activated — live DEI reports, public company data, and benchmarking surveys, all filtered for 2025-2026 recency
2: Diversity Benchmarking Report
Step 2: The benchmarking comparison — your workforce data vs current industry averages, every benchmark dated

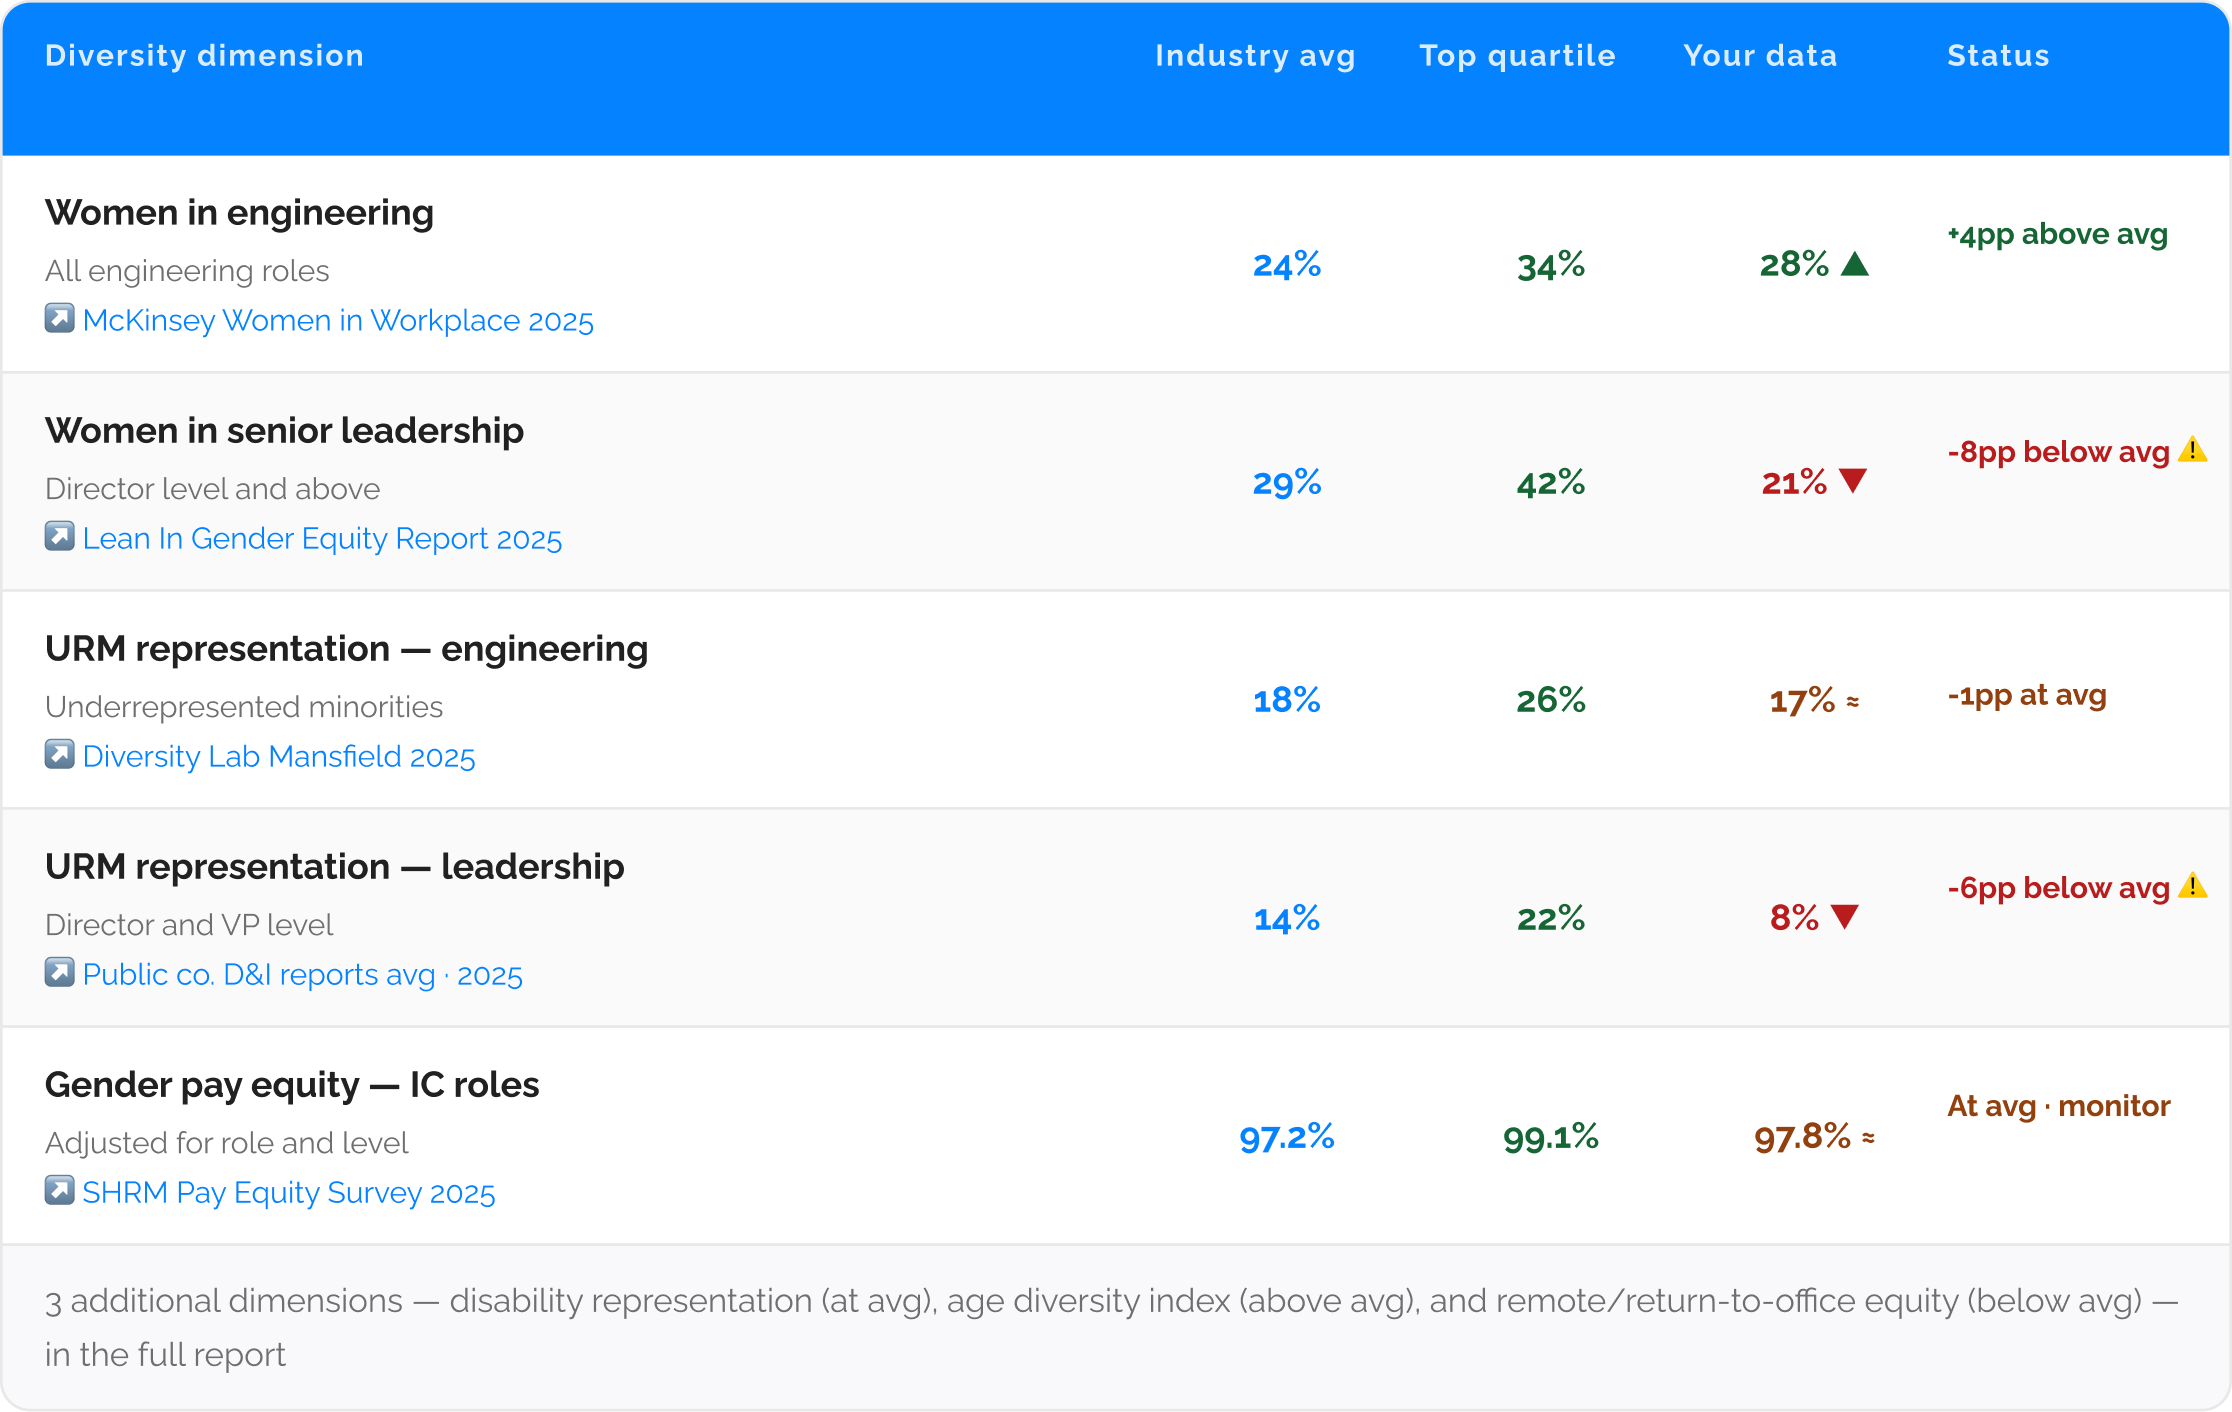
The two priority gaps (women in senior leadership at -8pp and URM leadership representation at -6pp) are compared against the 2025 benchmark, not 2022 data: The industry average for women in senior leadership in tech was 27% in the 2022 McKinsey report. The 2025 figure is 29%. Your company at 21% was closer to average in 2022 than the current comparison suggests. Using the current benchmark identifies the gap as it exists today, which is the only way to set a meaningful improvement target for the next 12 months.
Delivered to People and Leadership Tools
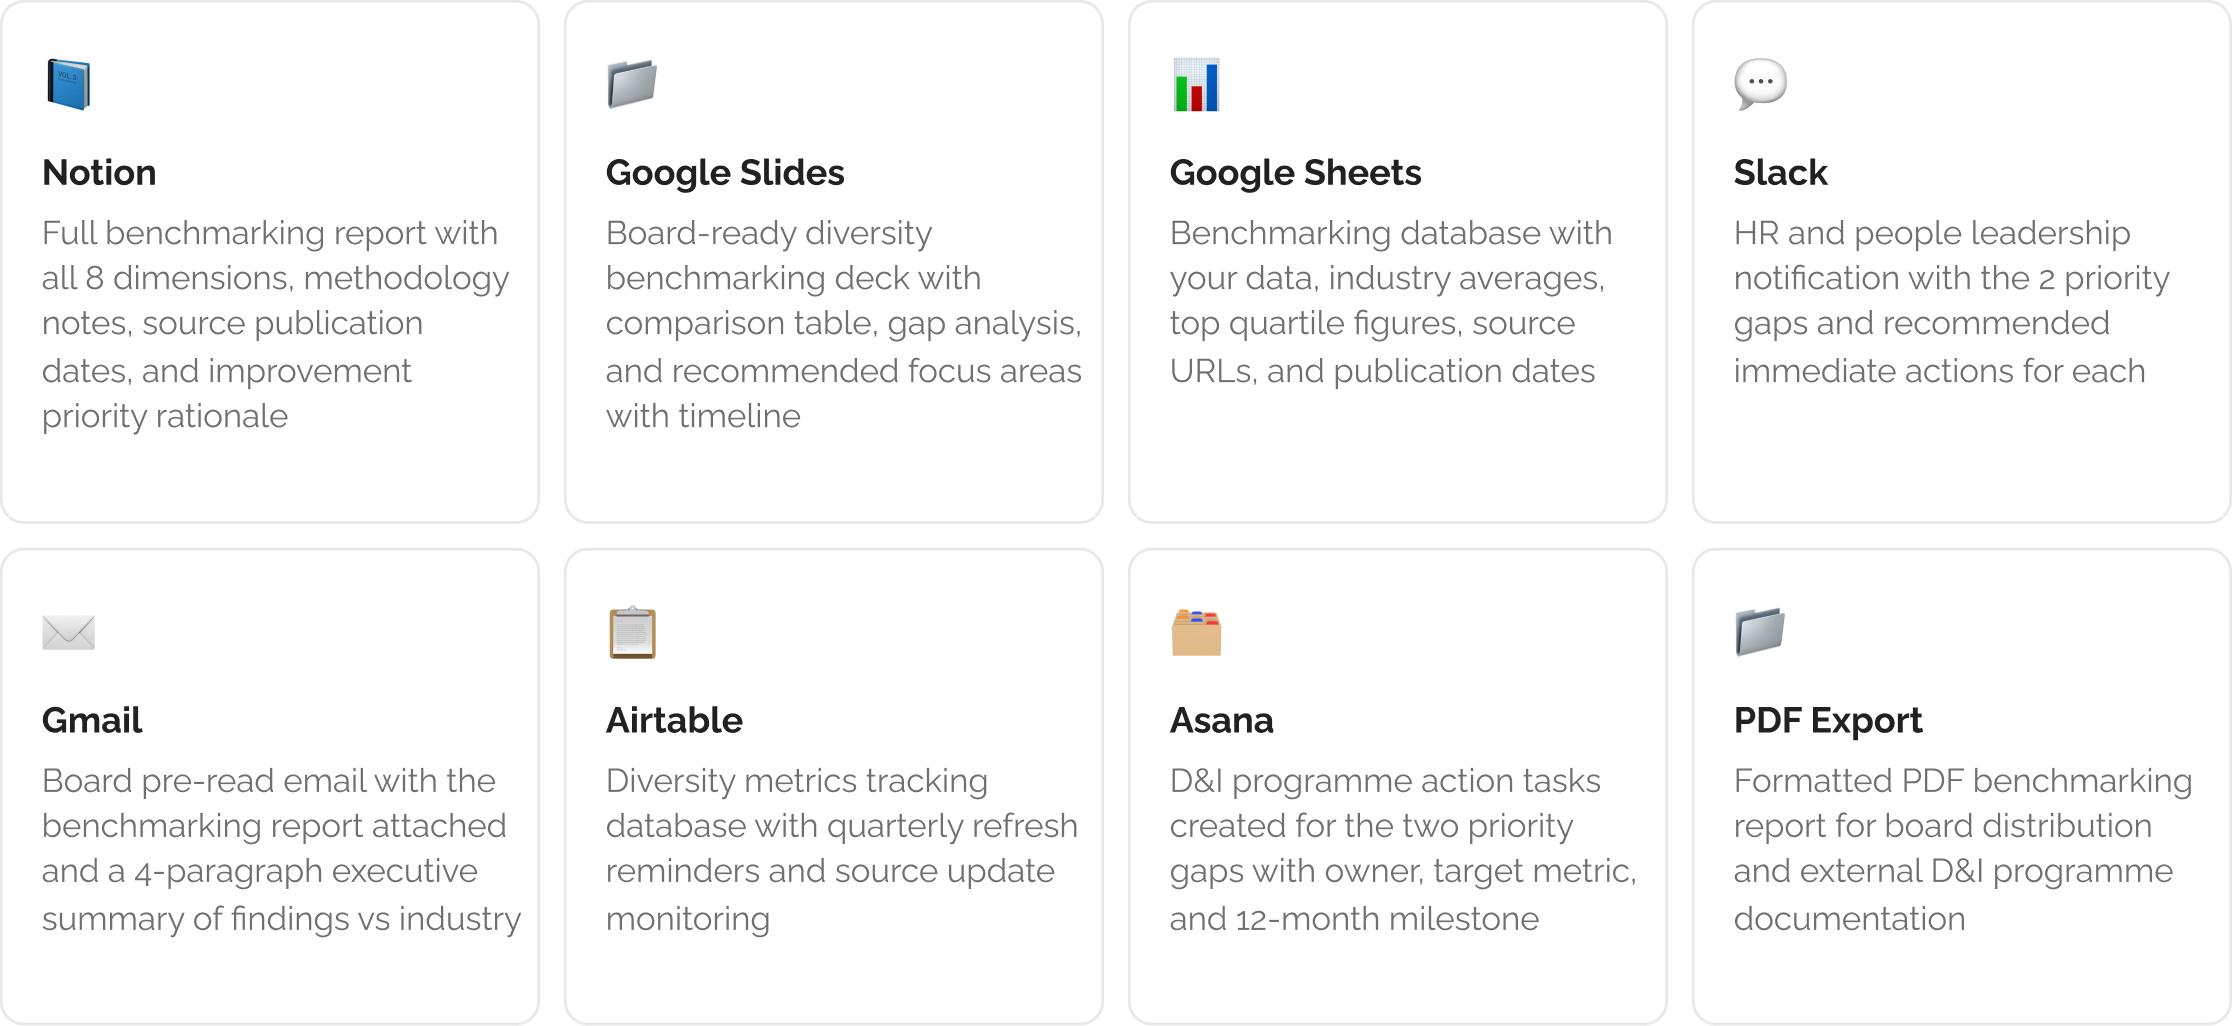
Step 3: The benchmarking report delivered to your HR, leadership, and board reporting tools
The Verdict
Comparing your diversity data against a benchmark from 2022 is comparing yourself against where the industry was, not where it is. The industry average for women in senior tech leadership changed between 2022 and 2025. The URM representation benchmark for tech engineering roles shifted as well. A company that maintained the same representation percentage over three years may have moved from above average to below average without changing anything — or vice versa. Barie retrieves diversity benchmarks from reports published in 2025 and 2026, applies recency filters before including any source, and documents the publication date of every benchmark in the output. The comparison you present to the board reflects where the industry stands today.
Barie features used in this task