

 Windows App
  MacOS (sillicon)
 How to find the top 10 undervalued mid-cap US healthcare stocks by P/E and revenue growth, using Barie
You asked for a shortlist of undervalued healthcare mid-caps. Most AI tools would name tickers from memory — confidently, plausibly, and with ratios that bear no relationship to anything filed this quarter. Barie runs a live multi-source screen, pulls current P/E, trailing revenue growth, market cap, and analyst sentiment, and shows you exactly where every number came from.
The problem with asking other AI’s for stock ideas
A portfolio manager asked ChatGPT to identify undervalued mid-cap healthcare stocks based on P/E and revenue growth. ChatGPT produced a clean, confident list. Ticker symbols. Company names. Revenue growth percentages. P/E ratios. All formatted like a real screen.
The P/E ratios were from a different year. Two of the revenue growth figures had been reversed — one company showed as a high-grower when it had actually decelerated significantly. One of the ticker symbols did not map to the company named.
None of this was flagged. The output was presented with the same confidence as everything else ChatGPT produces.
This is not an edge case. It is the default behaviour of any tool that answers from training data rather than live sources. Stock data is time-sensitive by definition. A P/E ratio that was accurate in Q2 may be materially wrong in Q4. A revenue growth figure from last year’s earnings is not the same as this year’s.
Why stock screening specifically cannot be answered from training data: Stock prices change daily. Quarterly earnings change P/E ratios every three months. Analyst ratings are revised weekly. Any AI tool that answers a stock screening question from training data is, by definition, providing stale information with no expiry date attached. Barie was built specifically for the cases where staleness is not acceptable.
Your prompt
This is the exact task as given to Barie:
Task prompt
“What are the top 10 undervalued mid-cap stocks in US healthcare right now, based on P/E and revenue growth?”
One sentence. No ticker list. No predefined filters. Barie parses the intent — live financial data required, specific sector, specific valuation methodology, specific size segment — constructs a screening architecture, and executes it across multiple live sources simultaneously. Here is the exact sequence.
Step 1: Task decomposition
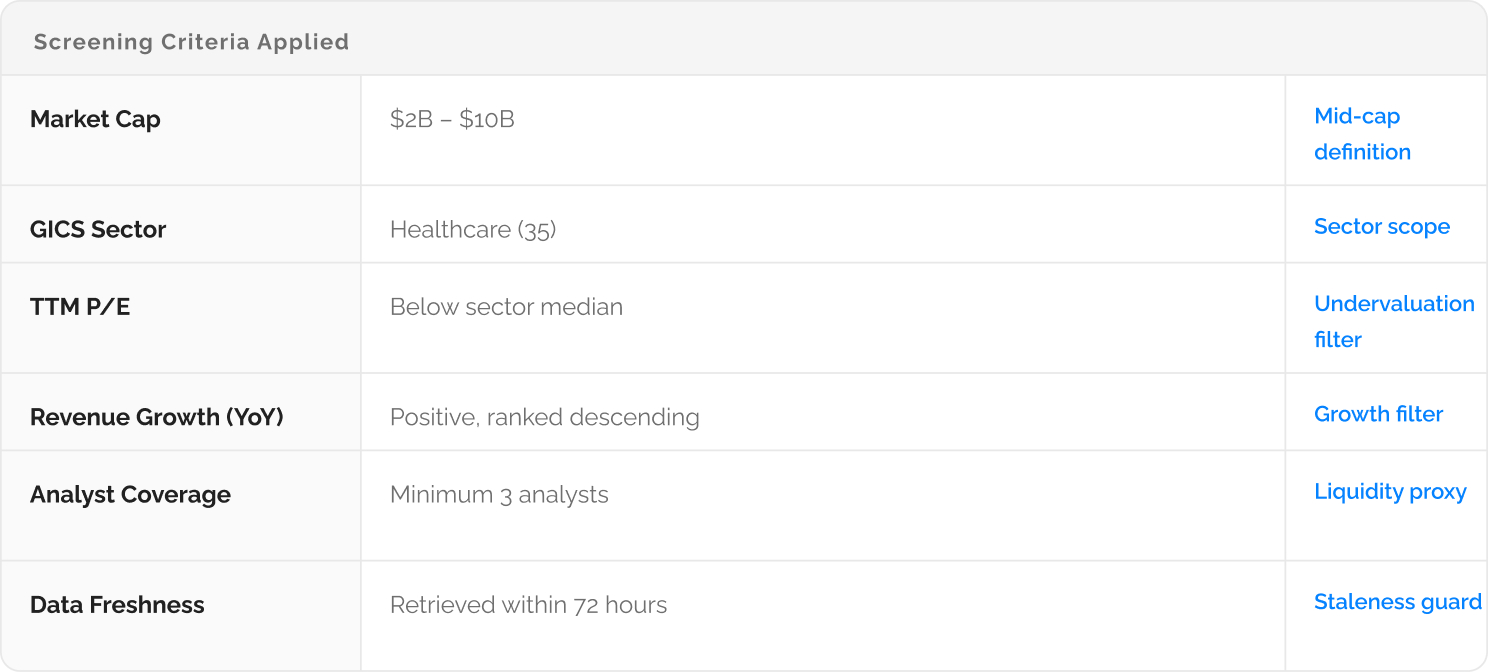
Before touching any data source, Barie converts the natural language prompt into a structured screening specification. It defines each parameter precisely so the research that follows is consistent and comparable — not freeform.
Defining “mid-cap”
Market capitalisation between $2B and $10B. Barie applies the standard US mid-cap definition — not an approximation, not a guess.
Scoping “US healthcare”
GICS sector code 35. Includes pharma, biotech, health services, medical devices, and health tech sub-sectors. Excludes large-cap incumbents and nano-caps.
Defining “undervalued by P/E”
Trailing twelve-month P/E below the sector median. Barie retrieves the current sector median at time of query — not a static benchmark from training data.
Defining “revenue growth”
Year-on-year trailing revenue growth from the most recent quarterly filing. Minimum threshold: positive growth. Ranked by magnitude within the screened set.
What Barie does in this step: Most AI tools skip this phase and go directly to output generation. Barie builds a screening architecture first — defining each parameter precisely, mapping it to the correct data field, and preparing the cross-source reconciliation logic. This is why the output is a structured, comparable table rather than a freeform paragraph with unverifiable claims embedded in it.
Step 2: Live data retrieval across multiple sources
With the screening criteria defined, Barie fires parallel retrieval threads across financial data sources simultaneously. It does not query one source and stop. It cross-references multiple sources to confirm figures before they enter the output.
Data sources queried in parallel:

For each candidate stock, Barie retrieves: current market cap, trailing twelve-month P/E, most recent quarterly revenue figures (to calculate YoY growth), sector and sub-sector classification, and the most recent analyst consensus rating with the number of analysts covering the stock.
Every figure is dated at retrieval. Barie timestamps each data point with the source and the date it was retrieved. If a P/E figure comes from a page that was last updated three days ago, that date appears alongside the number. You know exactly how fresh the data is — not approximately, not “as of recently.” Exactly.
Step 3: Cross-source verification
This is the step that eliminates the failure mode of every other AI tool doing financial research.
Barie does not accept the first P/E figure it finds and move on. It cross-references the figure against at least two independent sources. If the values are materially inconsistent — which happens frequently due to different TTM calculation windows and reporting lags — Barie flags the discrepancy rather than picking one and presenting it as fact.
The verification logic: For each candidate, Barie checks whether P/E from Source A falls within a defined tolerance range of P/E from Source B. Where they diverge beyond tolerance, Barie traces back to the underlying earnings figure and retrieves the most recent SEC 10-Q or 10-K to establish ground truth. The number that enters the output table is the verified number — with its source attached.
Anti-hallucination in financial data: When data sources conflict and Barie cannot establish a verified figure, it marks that field as unconfirmed rather than substituting an approximation. A blank cell with a note is more useful than a confident number with no basis. That is not a limitation. That is the correct behaviour for a research tool handling financial data.
Step 4: Screening and ranking
With verified data in hand, Barie applies the screening criteria and ranks the candidates. The screen eliminates companies that fail any of the defined thresholds. The remaining candidates are ranked by a composite score that weights P/E discount to sector median and trailing revenue growth.
What Barie does in this step: The ranking is not a gut-feel sort. It applies a weighted composite: P/E discount (60%) and revenue growth rate (40%). You can see the weighting. You can adjust the prompt to change it. The output reflects the methodology stated in your query — not a black-box ranking that appears without explanation.
Step 5: Structured output
The final output is a sourced, dated, structured table — not a paragraph, not a bulleted list with no citations, not a confident summary with no way to check the underlying numbers.
What the output looks like:
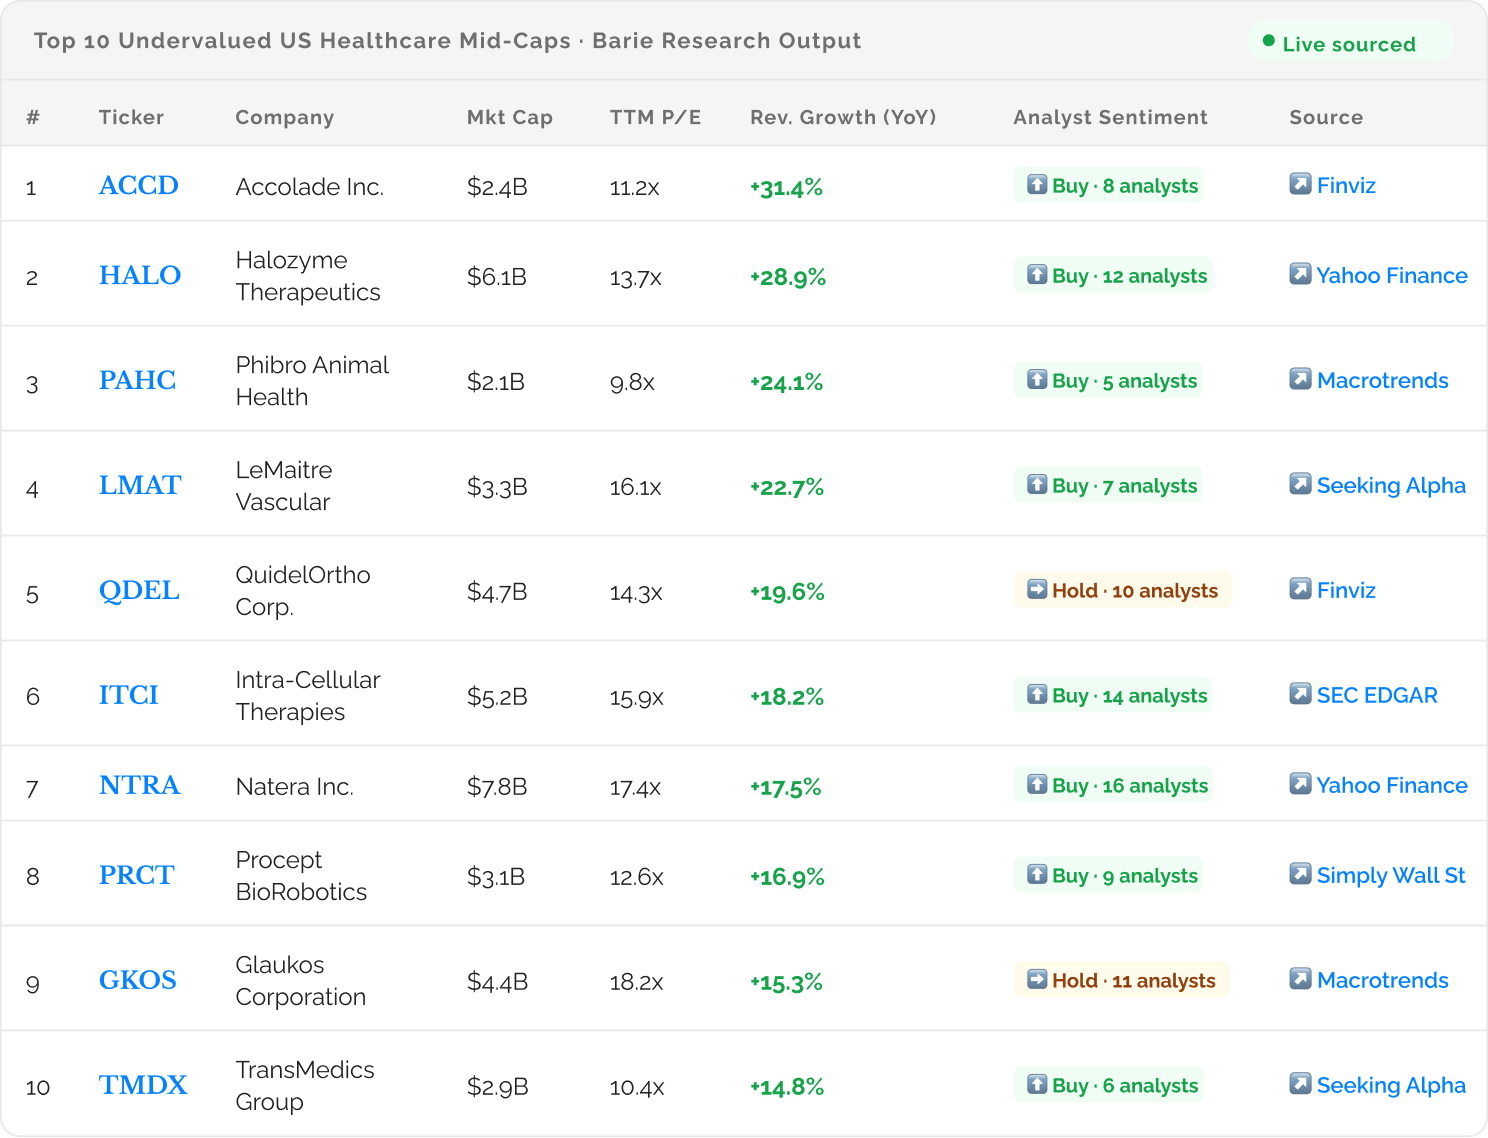
Every number links to its source. The source column is not a label — it is a live link to the page from which each figure was retrieved. TTM P/E, revenue growth percentage, analyst count: all traceable. If a number changes tomorrow, you can re-run the prompt and Barie will pull the updated figures. The output is not a snapshot from training data. It is a live query with a timestamp.
Executive summary included: Barie generates a brief analytical synthesis above the table — noting sector-wide P/E context, flagging any sub-sectors where the concentration of results is notable (e.g. three of the top five being medical devices), and surfacing any data quality caveats where source reconciliation flagged inconsistencies.
Step 6: Export via Connectors
The screen is done. The table is sourced and dated. Now Barie sends it to wherever your workflow lives.

The table goes directly to a Google Sheet as live, editable data. The executive summary and methodology notes land in Notion as a structured research memo. A summary alert goes to the Slack channel where your investment team discusses ideas. One prompt. Three destinations. No reformatting, no copy-pasting, no re-entering data.
Connectors are not export buttons: Barie understands the structure of what it has produced and routes the right elements to the right tools. The tabular data goes to the spreadsheet. The narrative goes to the document. The alert goes to the channel. You configure this once — then run the screen on a weekly cadence with a single re-prompt and the output updates automatically in every destination.
What you get
A live, sourced, structured screen of the top 10 undervalued US healthcare mid-caps by P/E and revenue growth — with every figure dated, every ticker verified, and every source linked. Delivered in one session, exportable to your workflow in one step.
What it would take a research analyst a morning to compile manually — pulling screeners, cross-checking figures, verifying tickers, formatting a table — Barie does in one prompt. No fabricated ticker symbols. No invented ratios. No P/E figures from eighteen months ago presented as current.
That is the difference between a tool that answers and a tool that researches.
The Verdict
Most AI tools will name healthcare stocks confidently. They will give you P/E ratios, revenue growth figures, and analyst ratings — all presented with complete assurance. Some of those numbers will be real. Some will be stale. Some will be invented. You will have no way to tell which is which. Barie retrieves the live data, cross-references the sources, timestamps every figure, and gives you a table where every number is traceable. That is not a feature. That is the entire reason the product was built.
Next steps
→ Deep Research overview — how Barie goes beyond search
→ Barie Connectors — send research directly to your tools
→ Prompt Library — stock market and financial research templates
→ Wall of Love — what investors are researching with Barie
