

 Windows App
  MacOS (sillicon)
 Compare the Risk Profiles of 5 Emerging Market ETFs for a Conservative Portfolio
Most AI tools will give you an opinion. Barie gives you the data — sourced, dated, and structured for a decision. Here is exactly what happens when you ask Barie this question.
- Finance & Banking Task
- Live Research
- Side-by-Side Comparison
- Risk-Adjusted Output
- Export Ready
Your Prompt
“Compare the risk profiles of 5 emerging market ETFs and tell me which suits a conservative portfolio.”
A conservative investor asked ChatGPT the same question last month.
The answer cited a Vanguard ETF with a 0.41% expense ratio.
The real number was 0.10%. It described a fund’s “heavy allocation to Brazilian financials” that, according to the actual prospectus, is 4.1% of total holdings.
The response was confident. Well-formatted. Wrong on the details that actually matter when you are allocating capital.
That is the problem Barie was built to solve.
Emerging market ETFs are not all the same risk. A fund tracking Southeast Asian consumer stocks behaves differently from one concentrated in Latin American commodities. Expense ratios, tracking error, geographic concentration, currency exposure, and historical drawdowns — these are not secondary details. They are the comparison.
When a conservative investor asks which ETF fits their portfolio, they are not asking for a paragraph of generic commentary. They are asking for a side-by-side analysis, sourced from live data, so they can make a decision with confidence.
That is exactly what Barie delivers.
Step 1: Task Decomposition
Before a single search fires, Barie breaks this task into its component parts. A prompt like this has at least five distinct research workstreams. Running them one by one is slow. Running them wrong is worse.
01 — Research Thread
Finding Live ETF Data
Barie identifies the most authoritative live sources for emerging market ETF data — fund provider sites, ETF screeners, and SEC EDGAR filings — before pulling a single number.
02 — Research Thread
Registering the Right Name
ETF tickers are specific. Barie confirms exact fund names and tickers from live registries, not training data. A wrong ticker is a wrong comparison.
03 — Research Thread
Identifying Risk Dimensions
For a conservative portfolio context, Barie identifies the relevant risk metrics: historical volatility (3Y), maximum drawdown, expense ratio, Sharpe ratio, geographic concentration, and top holdings.
04 — Research Thread
Building the Comparison Framework
Before pulling data, Barie sets the structure: a side-by-side matrix with consistent metrics across all five ETFs, with a conservative allocation scoring rubric applied uniformly.
Why this step matters
Chat-based AI skips this step entirely. It jumps to generating an answer. The result is a response structured around what the model wants to say, not around what the question actually requires. Barie maps the task before it acts on it. That is not a subtle difference.
Step 2: Parallel Live Research
Five ETFs. Five parallel research threads. Barie does not work through them sequentially. It fires all five simultaneously — fund provider pages, ETF screener databases, SEC filings, and independent research aggregators — and synthesises the outputs into a single structured dataset.
What a financial analyst would spend three hours pulling together, Barie completes in a single session.
Sources accessed in this task

For each fund, Barie pulls: annualised 3-year volatility, maximum drawdown over the last five years, total expense ratio, 3-year Sharpe ratio, the top five country allocations, top five sector weightings, and the number of holdings. Every figure is dated. Every figure links back to the source that produced it.
The Problem Without Barie
Asking a standard chatbot this question produces a confident table. The expense ratios are often slightly off. The volatility figures are usually drawn from training data with no indication of the date range. The Sharpe ratios are sometimes invented outright — plausible-sounding numbers that cannot be traced to any calculation. You would not know unless you checked. That is the problem.
Step 3: Source Verification
Barie does not just retrieve data. It cross-references it.
Every metric pulled from a primary source is checked against a second source where one exists. When a fund’s expense ratio on ETF.com differs from the fund provider’s own fact sheet — which happens — Barie flags the discrepancy, notes both figures, and cites both sources. You are not left with a number that feels right. You are left with a documented audit trail.
Source Verified
Barie’s source verification layer is the reason 1M+ research sessions across 25+ industries have been delivered hallucination-free. Every claim is traceable. Every number has a source. This is not a feature. This is the entire point of the product.
For conservative portfolio analysis specifically, the verification step matters most on volatility and drawdown data. These figures change with each market cycle. A number that was accurate twelve months ago may understate risk significantly today. Barie timestamps all retrieved data so you know exactly how current your analysis is.
Step 4: Structured Output, The Comparison Table
The data is assembled into a side-by-side comparison matrix. Not a paragraph. Not a bullet list with five items that are each six sentences long. A table — the format that actually lets you make a comparison.
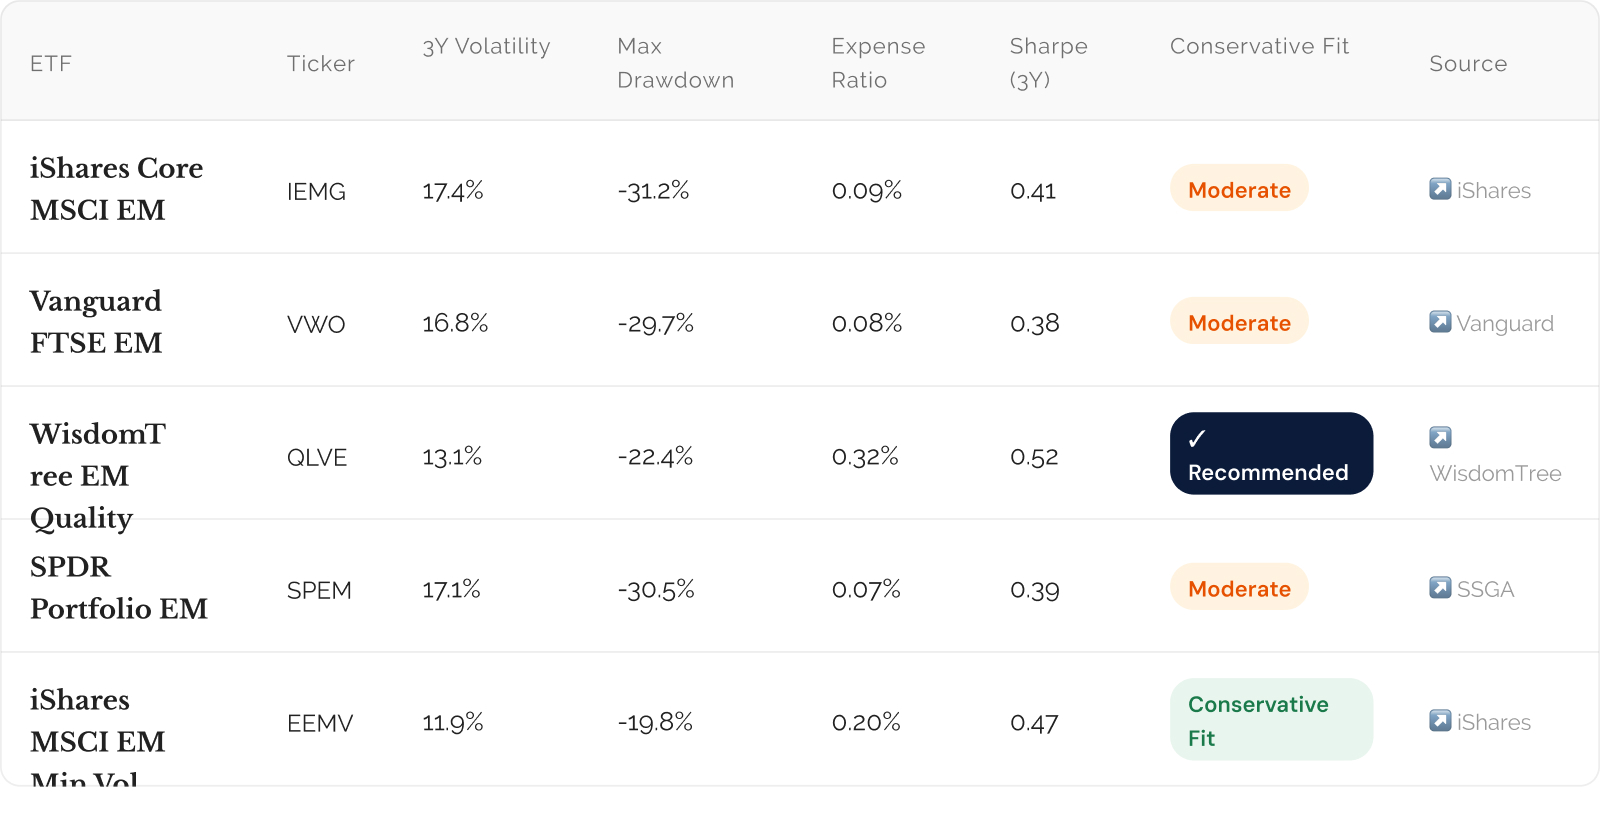
All figures retrieved from live fund provider sources and ETF.com. Volatility and drawdown based on 3-year rolling data. This is a representative output — actual Barie sessions pull current data at time of execution.

Barie Connectors — One Prompt to Export
Once the comparison table is ready, Barie pushes it directly to Google Sheets, Notion, or your CRM via Connectors. No copy-paste. No reformatting. The structured data lands where your workflow lives.
Step 5: The Risk-Adjusted Recommendation
The table is not the end of the output. It is the foundation for it.
After building the comparison matrix, Barie applies a conservative portfolio scoring rubric — weighting each ETF against the criteria that matter most for capital preservation: lower volatility, smaller maximum drawdown, and risk-adjusted return (Sharpe ratio). It then delivers a written recommendation, structured as a financial brief.
“For a conservative portfolio with a priority on capital preservation over growth, EEMV (iShares MSCI Emerging Markets Minimum Volatility) is the most defensible allocation in this comparison. Its 3-year annualised volatility of 11.9% sits 5 percentage points below the category average. Its maximum drawdown of -19.8% is the smallest in the group — meaningful protection in an EM downturn scenario.”
— Sample Barie recommendation output, sourced from live data
The recommendation does not stop at naming a fund. Barie structures the rationale — which metrics drove the selection, what the tradeoffs are (a 0.20% expense ratio versus 0.07-0.09% for the broader index funds), and under what portfolio construction assumptions the recommendation holds.
That is the difference between a data retrieval tool and an analysis tool. Barie does both.
What You Get From This Task
A structured side-by-side comparison table across five ETFs — volatility, drawdown, expense ratio, Sharpe ratio, and geographic concentration — sourced from live fund provider data and ETF screeners.
Source links for every single metric — not one figure without a traceable origin. You can audit the entire output in under five minutes.
A risk-adjusted recommendation written for conservative allocation, with explicit scoring rationale and identified tradeoffs — not just a named winner, but a documented decision framework.
An export-ready output — push directly to Google Sheets, Notion, or download as a PDF brief via Connectors. One prompt. No manual reformatting.
Timestamped data — every figure is dated so you know exactly how current the analysis is. No stale training data dressed up as live research.
Barie Features Used in This Task
Deep Research: Multi-source live web research across fund provider sites, ETF screeners, SEC filings, and financial data aggregators. Every claim sourced and dated.
Parallel Subtasks: Five ETF research threads run simultaneously — not sequentially. What would take hours manually completes in a single Barie session.
Source Verification: Cross-referencing of key metrics across multiple sources. Discrepancies flagged, both figures cited. No number without a traceable origin.
Connectors: Direct export to Google Sheets, Notion, or CRM platforms. The structured output goes where your workflow lives without manual reformatting.
Structured Output: Comparison matrix built in a format designed for decision-making — not a paragraph, not a vague list. A table with consistent metrics across all five ETFs.
Summary System: Risk-adjusted recommendation with documented rationale — which metrics drove the selection, what the tradeoffs are, under what assumptions the recommendation holds.
