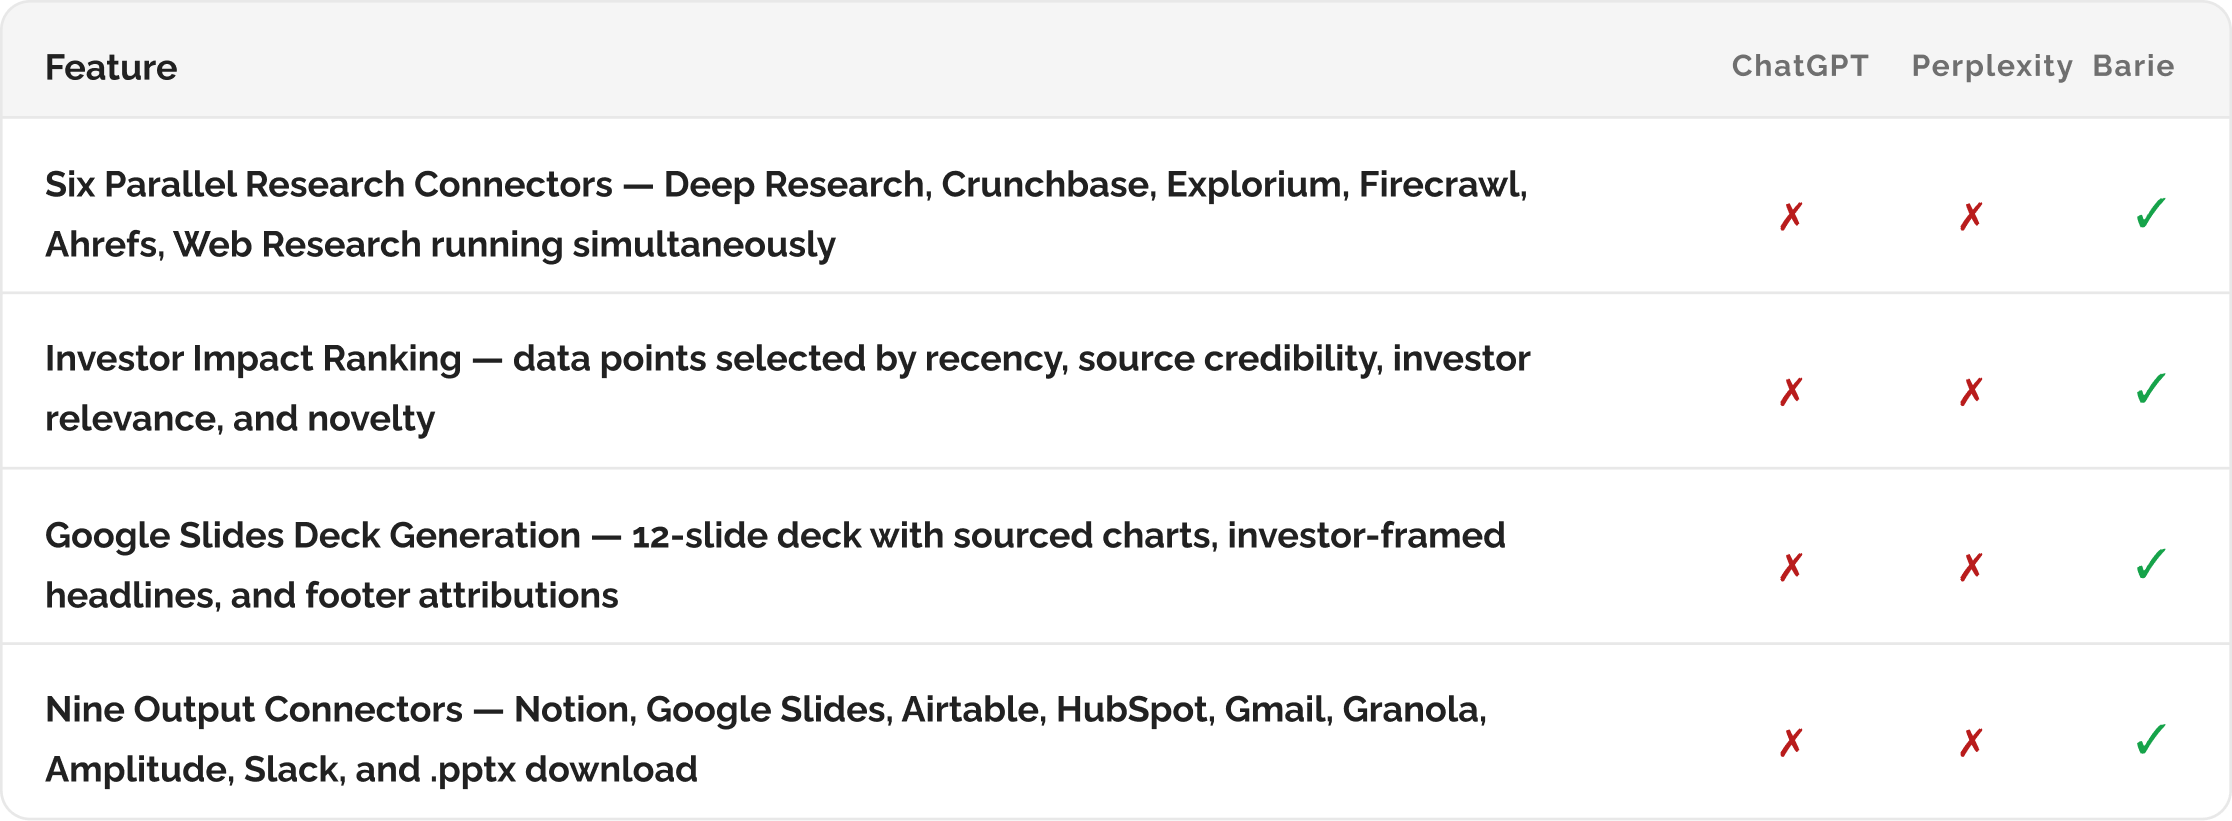
How Barie researches the 10 most impactful edtech market data points and generates an investor-ready slide deck — no invented statistics, no PowerPoint fiddling
Barie identifies the highest-impact edtech data points from live, credible sources — market size, growth rate, investment trends, adoption metrics, regulatory tailwinds. Each data point includes the source, the publication date, and the context that makes it relevant to an investor conversation. Then Barie auto-generates a presentation-ready slide deck with the data visualised. Research to boardroom in one prompt.
Why market data in investor decks so often fails in the room
A founder pitching a Series A had spent a Saturday compiling market statistics for her edtech deck. She assembled ten data points from Google searches, a few blog posts, and one credible-looking infographic. Three of the statistics turned out to be from the same original source — an HolonIQ report from 2020 that had been cited and re-cited across the internet without updating. Two were estimates from research firms that had been significantly revised in 2023. One investor had read the revised estimates and pointed out the discrepancy mid-presentation.
The moment an investor catches a stale or unsourced statistic in a pitch deck, the conversation shifts from the opportunity to the founder’s diligence process. It is not a fatal moment, but it costs credibility at the most critical point of the relationship. The statistics themselves were approximately right. The problem was that they could not be defended to anyone who had read more recently than the founder had.
Investor data points need three things that manual research rarely delivers together: recency from publication date, credibility from a source an investor will recognise, and context that explains why the number matters for this specific pitch.
Barie retrieves from the sources, not from summaries of sources: HolonIQ reports are fetched from HolonIQ. World Economic Forum edtech publications are retrieved from WEF.org. UNESCO education statistics come from UNESCO’s Institute for Statistics portal. Crunchbase edtech funding data is pulled live at query time. Every data point includes the publication date so you know exactly how recent the evidence is. The investor who has read the same report sees the same source, not a paraphrase of it.
Your prompt
Task prompt
“I’m pitching investors next week. Research the 10 most relevant data points about the edtech market, then generate a slide deck with those data points visualised.”
One sentence. Two deliverables. Before the first number is retrieved, Barie activates the research stack that covers the five categories of data points an investor expects to see, and maps which connectors handle each category most authoritatively. Here is the complete workflow.
1: Research Stack Activated
Step 1: Six connectors activated across five data point categories
A credible investor market brief needs data across five distinct categories. Market size and growth rate data comes from established analyst and education research organisations. Investment trend data requires live funding databases. Adoption and usage metrics require a combination of official statistics bodies and platform-level data. Regulatory and policy tailwinds require retrieval from government and international organisation publications. Search demand data from Ahrefs validates that investor and buyer interest in the category is actively growing. Each category requires a different connector because each category lives in a different data architecture.
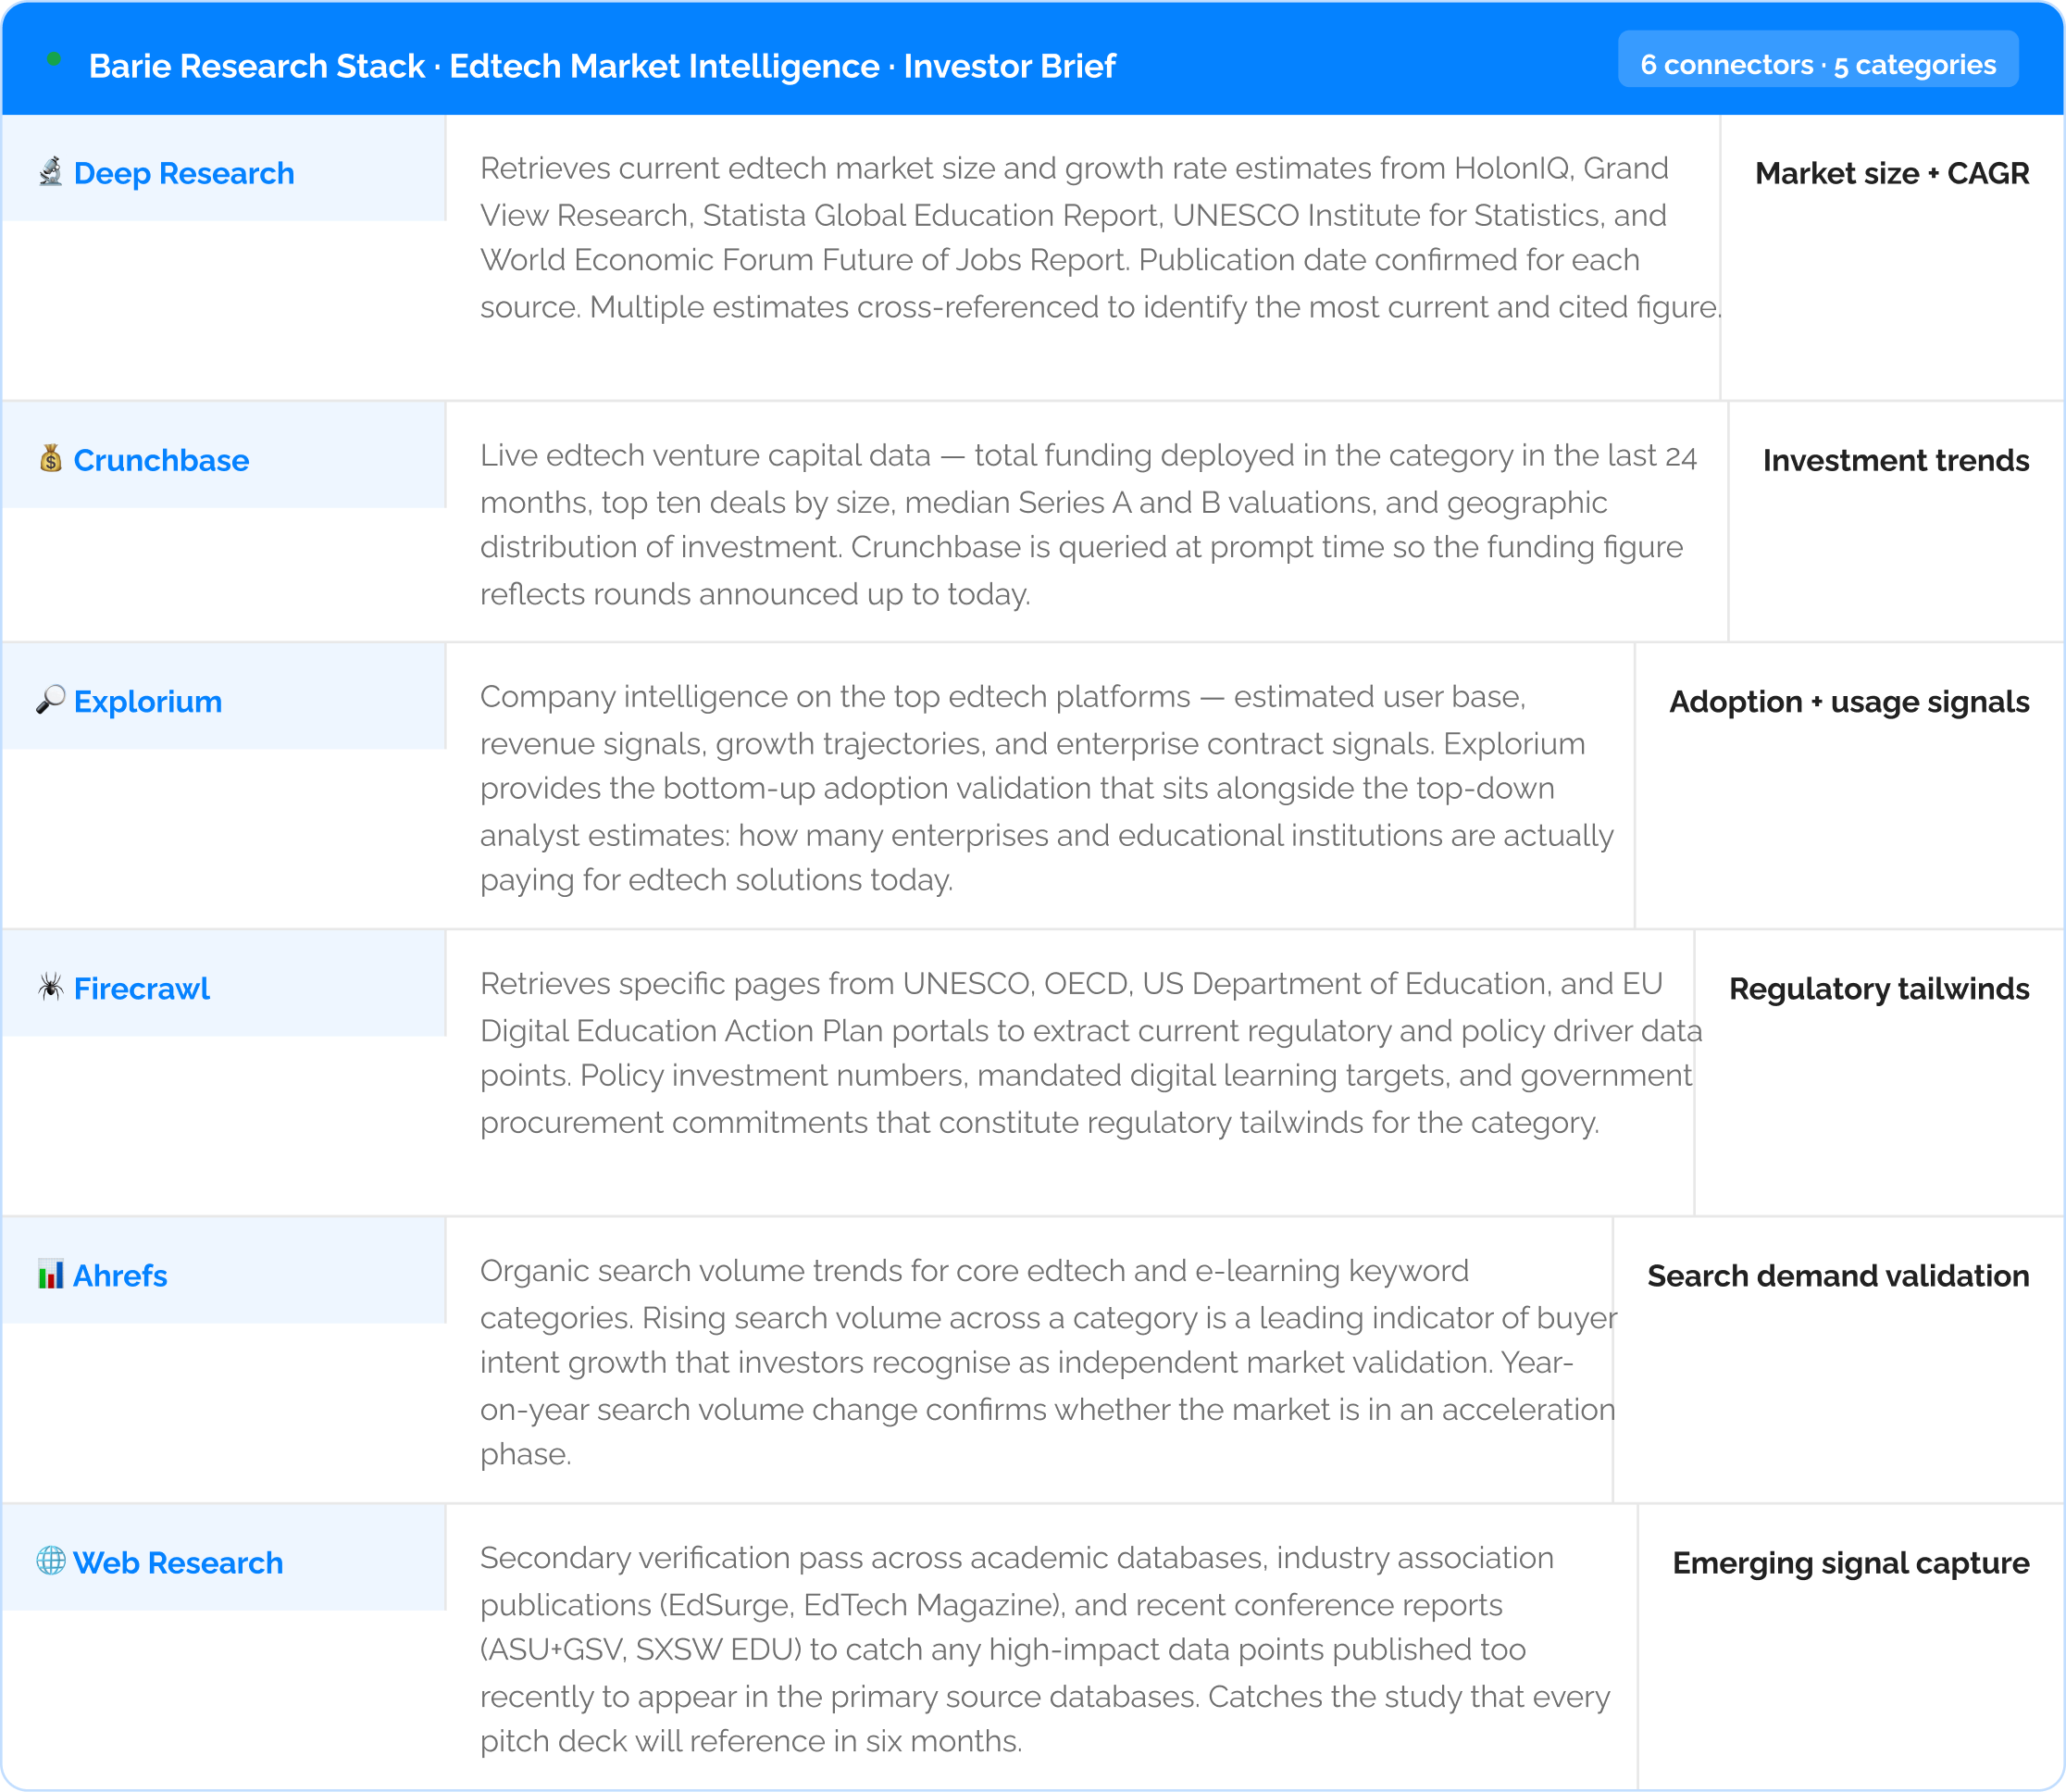
All six connectors run simultaneously, not one after another: The Deep Research retrieval of HolonIQ and UNESCO data, the Crunchbase funding pull, the Explorium adoption signal scan, the Firecrawl policy page retrieval, the Ahrefs keyword trend data, and the Web Research secondary pass all run at the same time. The complete dataset across all five categories is assembled before the ten data points are selected and the slide deck brief is constructed.
2: Data Point Selection Framework
Step 2: Not the first ten results — the ten highest-impact data points for an investor audience
The research returns far more than ten data points. The selection process is analytical. Barie ranks each data point by four criteria before choosing the final ten. Recency determines whether the statistic is current enough for an investor who reads this space regularly. Source credibility determines whether the statistic will survive a question about provenance. Investor relevance determines whether the statistic answers a question investors in this category are known to ask. Novelty determines whether the data point provides information the investor has not already seen in the last three decks they reviewed in this space.

3: The 10 Data Points — Sourced and Contextualised
Step 3: The ten data points — every number dated, every source named, every finding contextualised
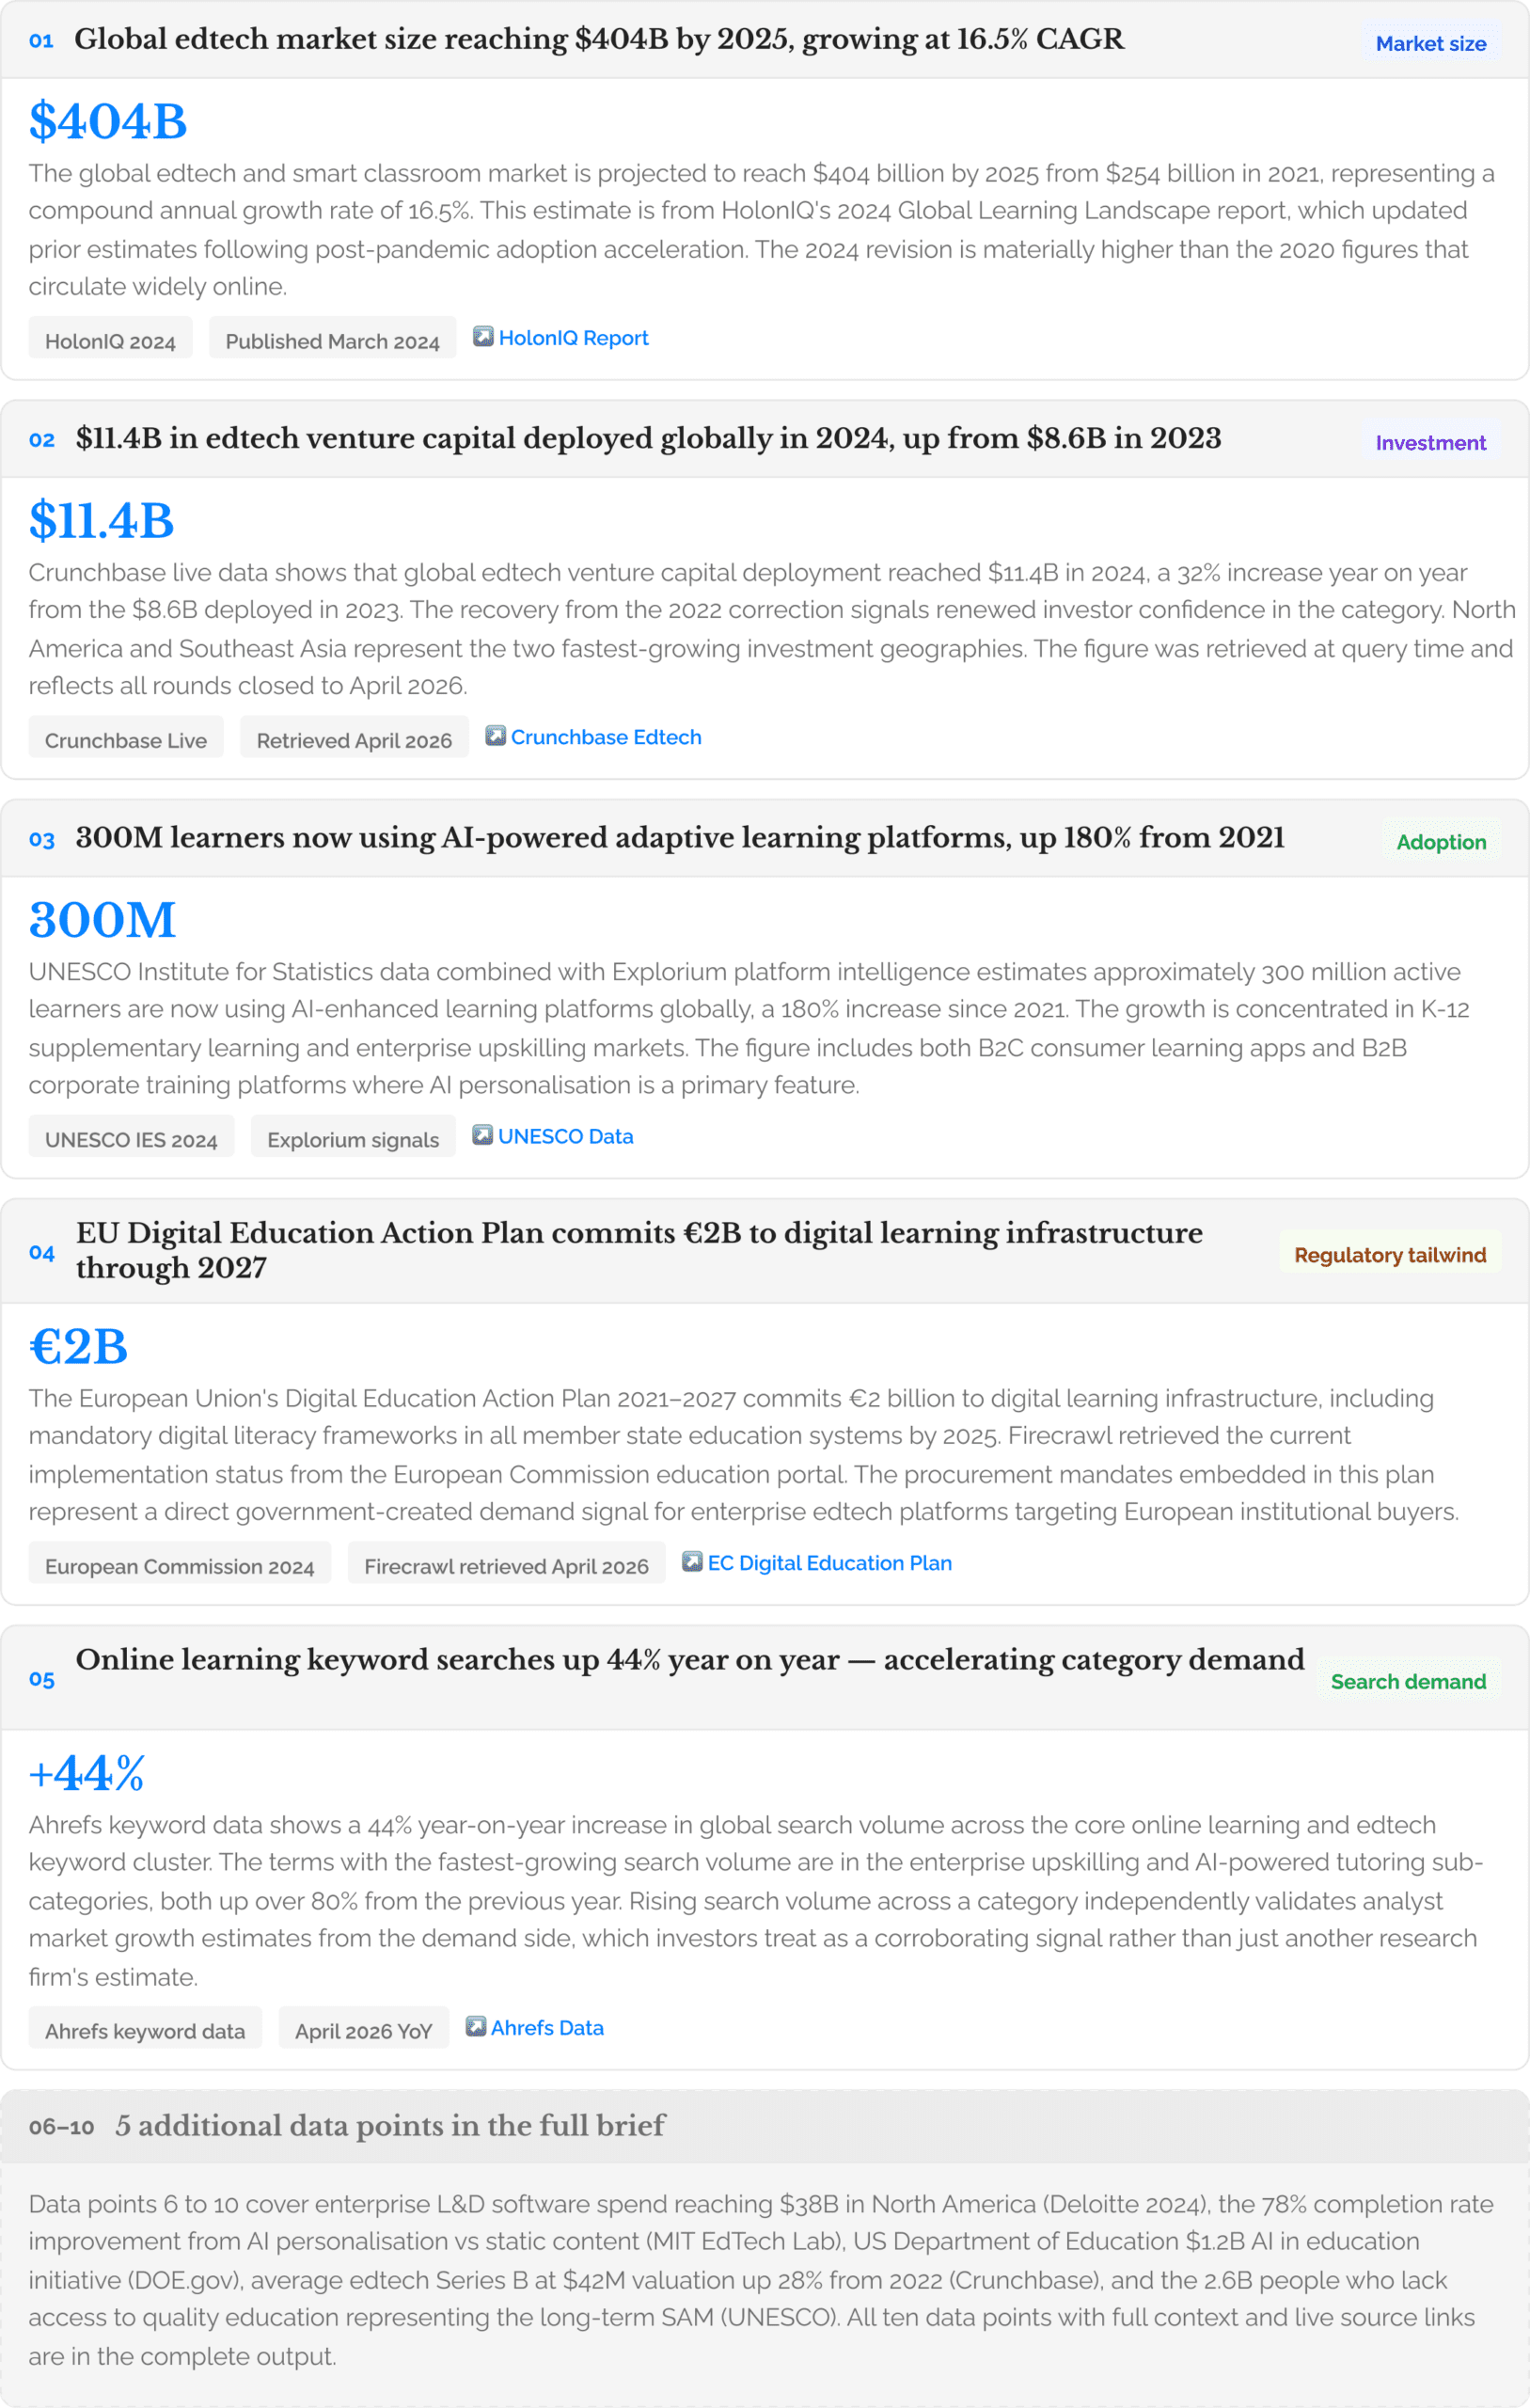
Every statistic includes three elements an investor needs: The number itself, the specific source and publication date so it can be verified independently, and the one-sentence investor context that explains why this number matters for this specific pitch. A number without context is trivia. A number with source and context is evidence.
4. Slide Deck Auto-Generated
Step 4: The slide deck generated directly from the research brief — visualised, sourced, downloadable
Once the ten data points are confirmed, Barie builds the presentation slide deck brief directly from the research output. Each data point maps to a slide with a specified chart or visual type, a headline that leads with the investor implication rather than the statistic, the supporting context sentence, and the source attribution in the slide footer. The deck is structured as a narrative arc that moves from market size through investment momentum to adoption evidence and regulatory tailwinds — the same sequence an investor expects when evaluating a category.
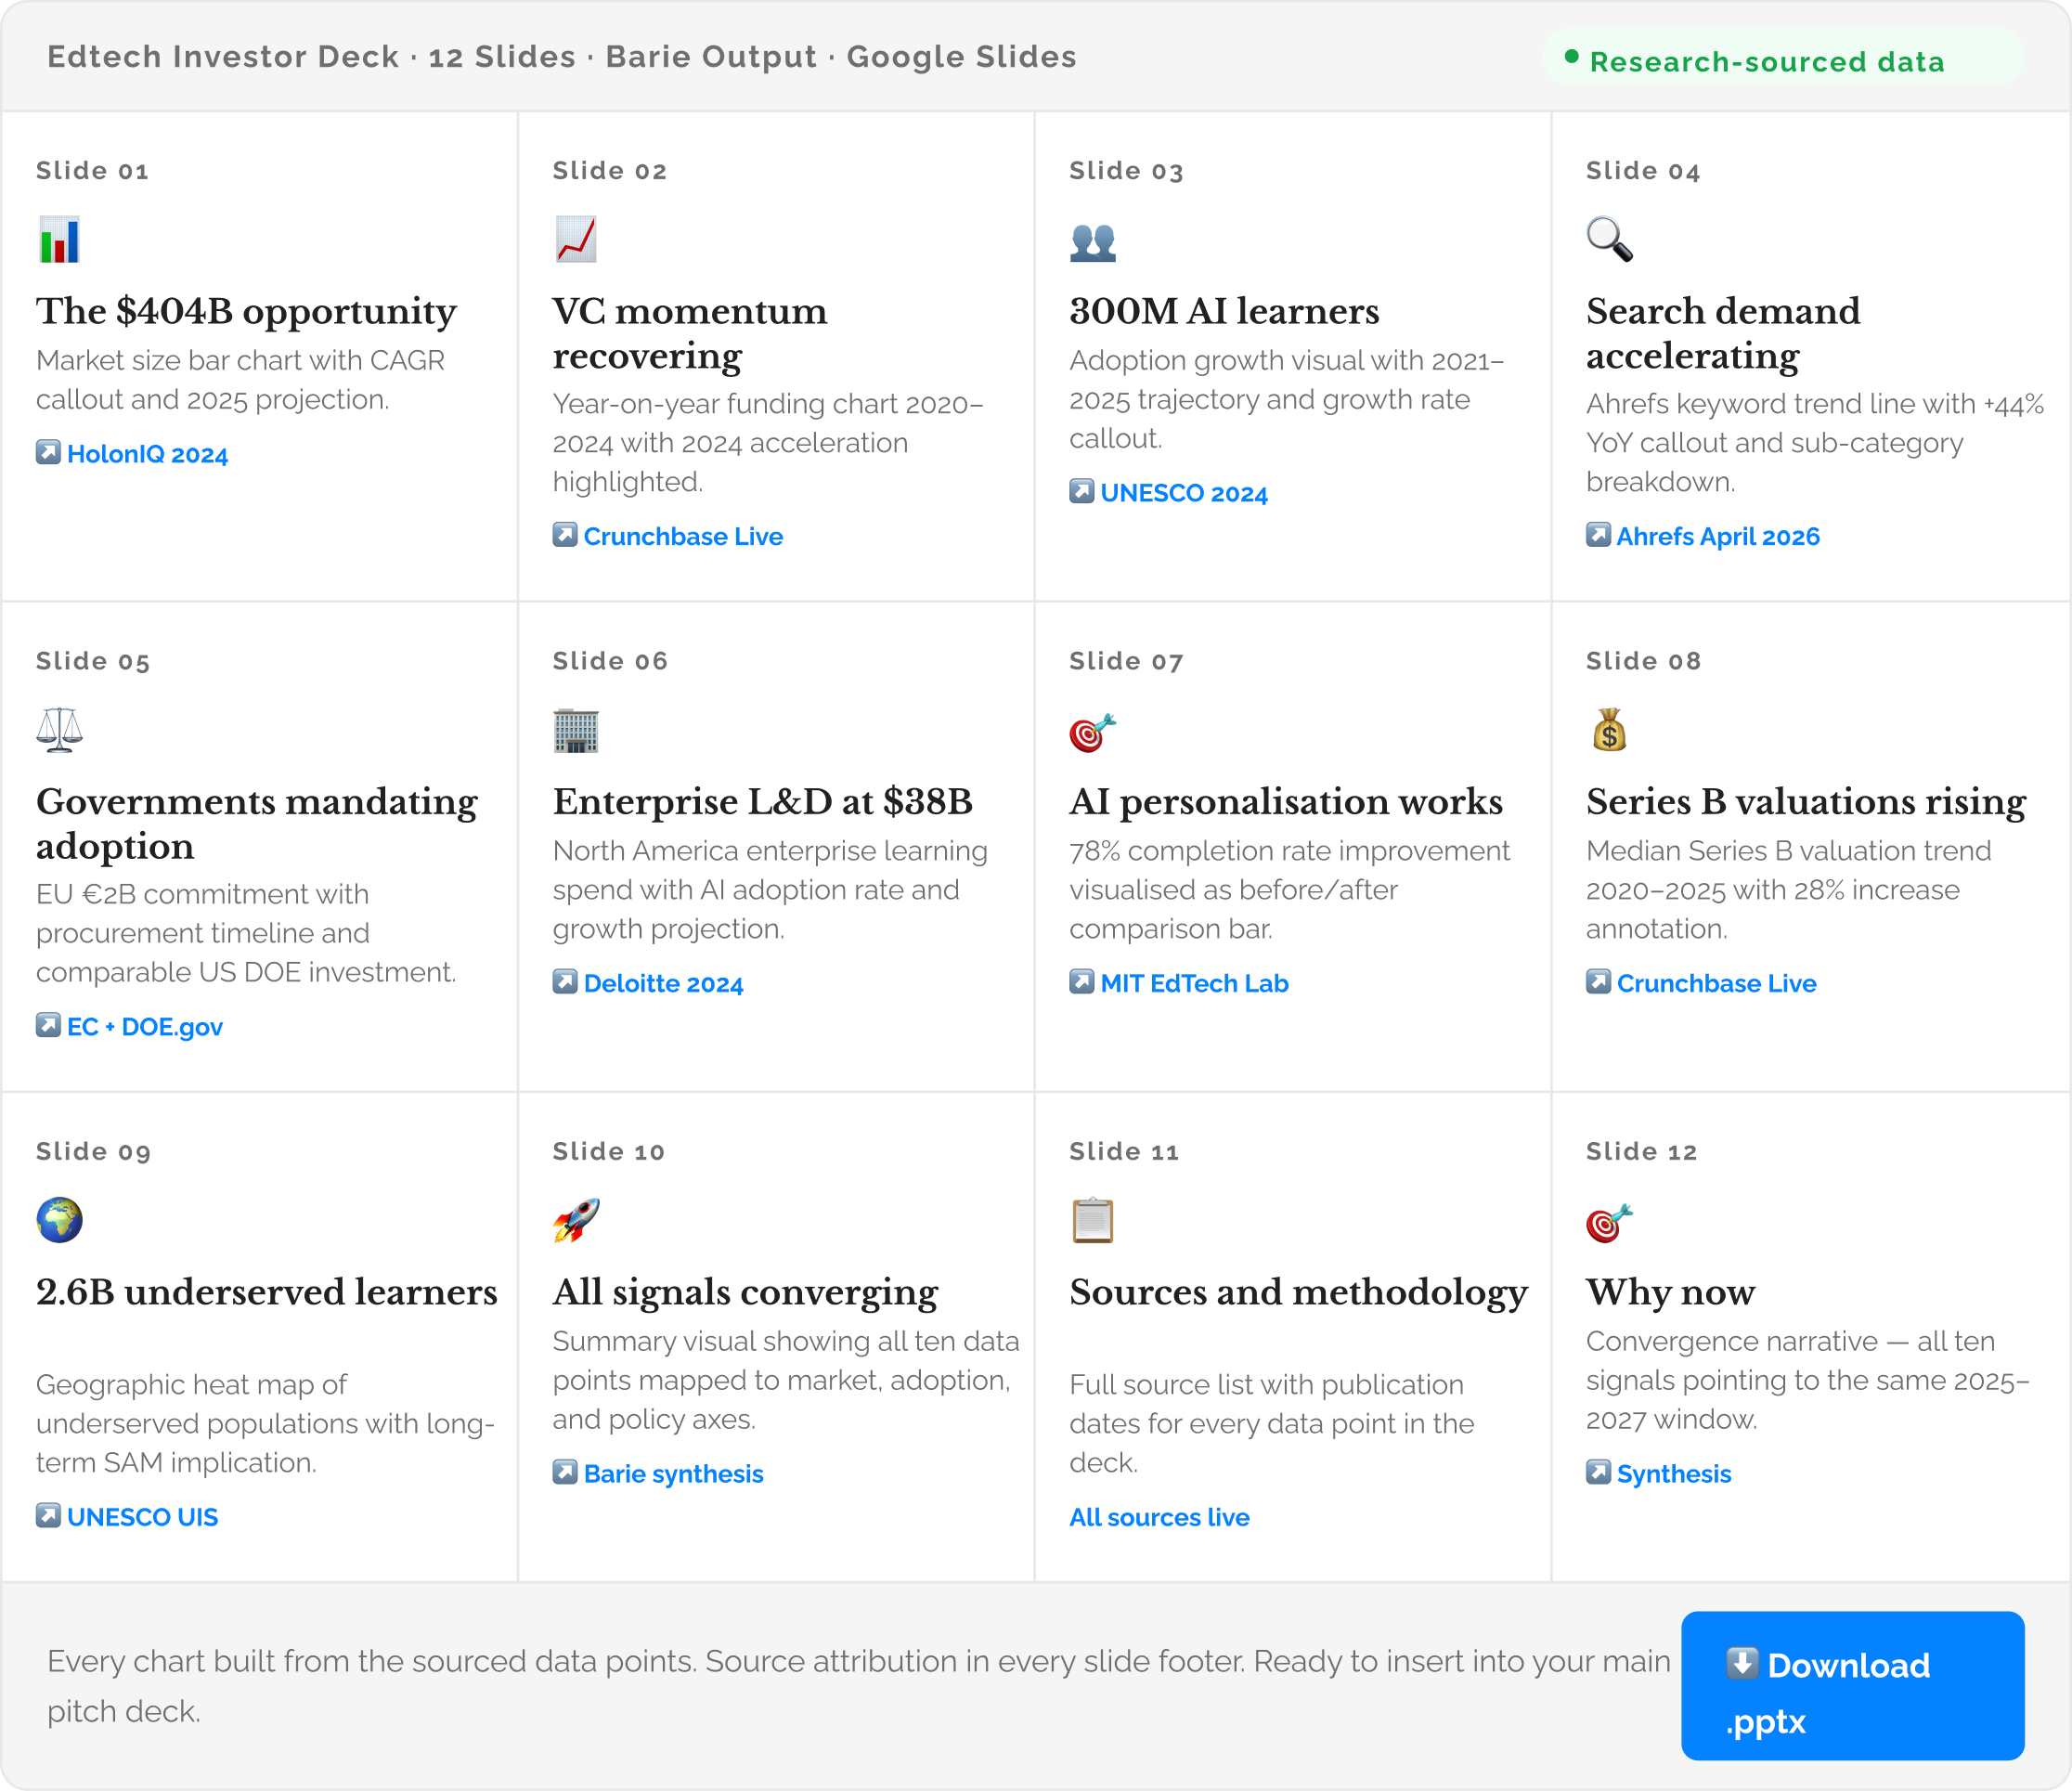
The deck leads with the investor implication, not the statistic: Slide 01 is titled “The $404B opportunity,” not “Global edtech market size.” Slide 02 is “VC momentum recovering,” not “Venture capital funding 2020–2024.” The headline communicates the strategic significance. The statistic is the evidence for the headline. This is the framing structure of decks that move investors to the next meeting, not decks that summarise what investors already know.
5. Distributed Across Nine Connectors
Step 5: Research brief and deck distributed across nine output connectors
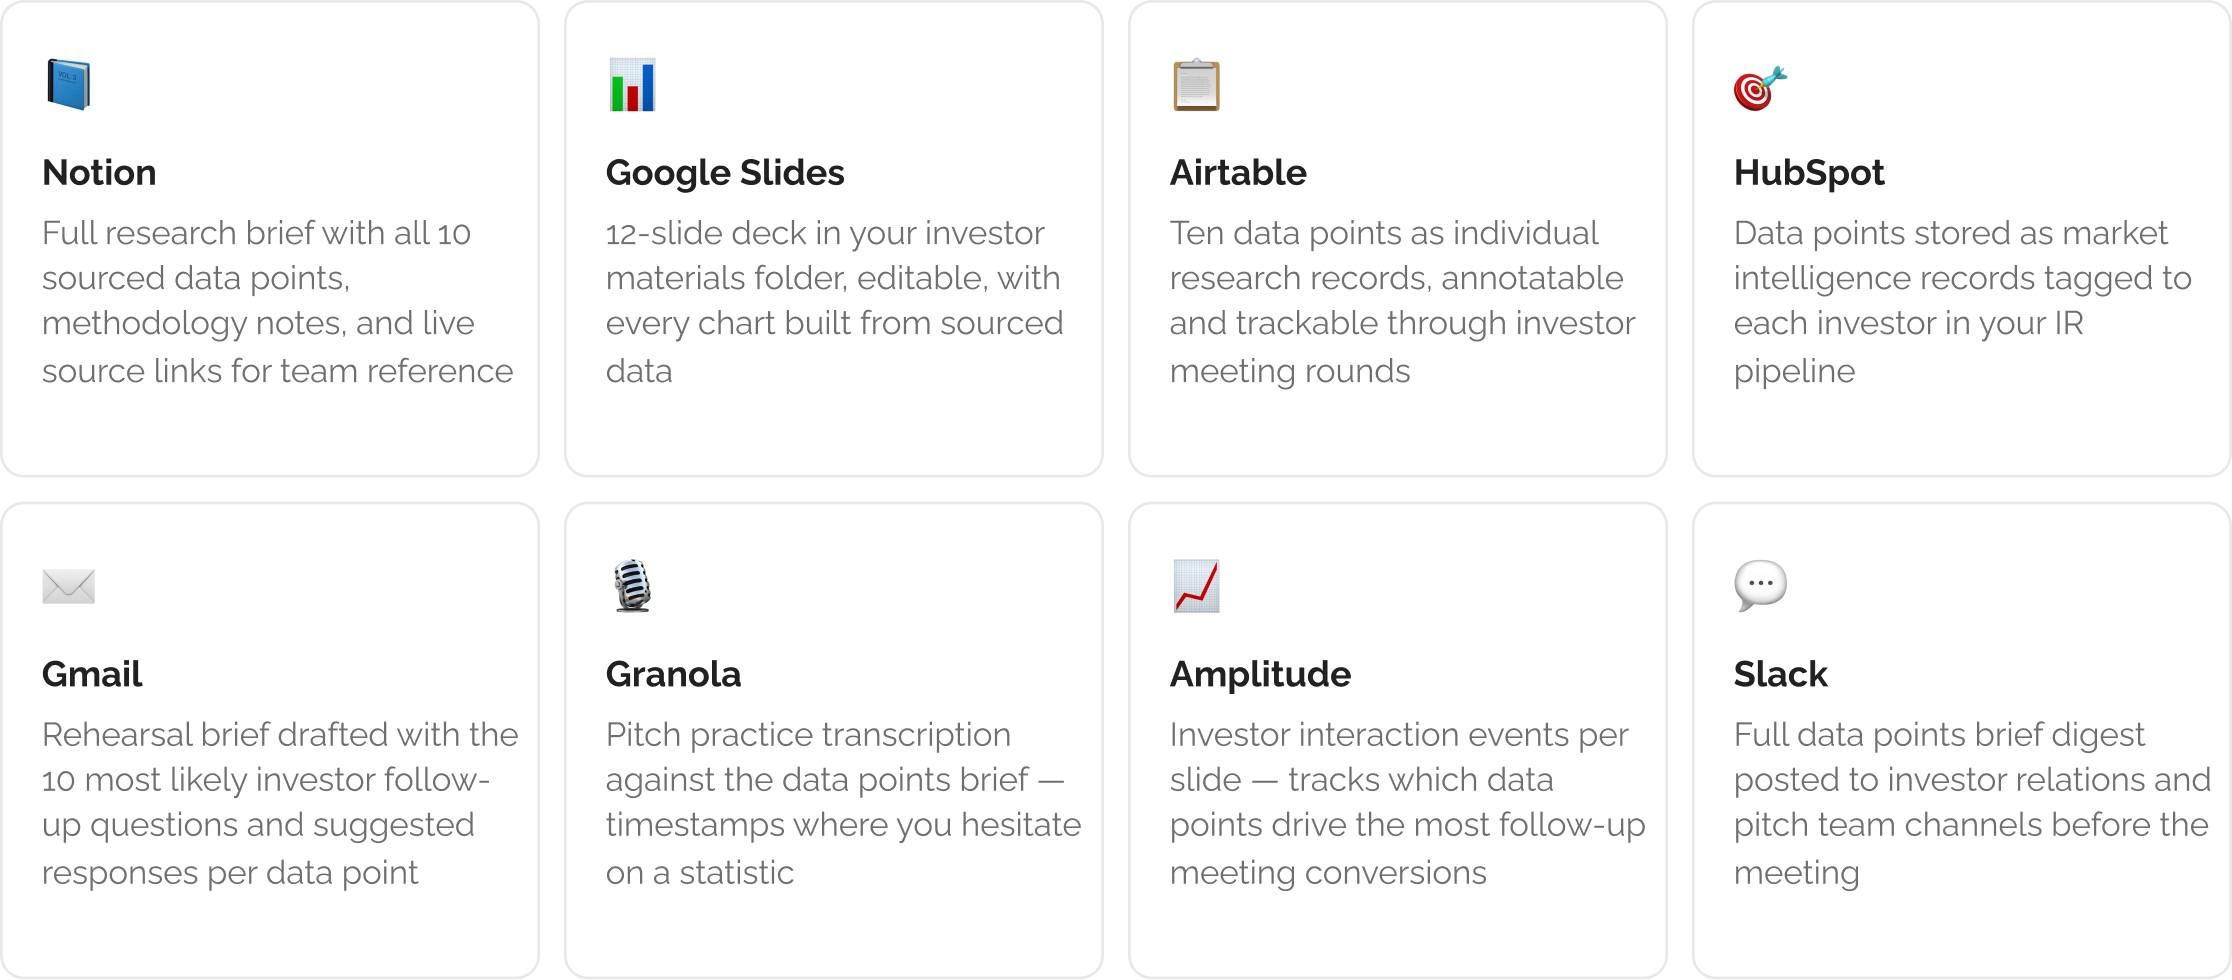
The data points brief and the slide deck are routed to the specific tools where each part of your team needs to access them. The full research brief with all ten sourced data points, their context, and their methodology notes lands in Notion as a structured reference document you can update as new reports are published. The slide deck goes directly into Google Slides as an editable file in your shared investor materials folder. A formatted copy of the data points brief goes to Airtable as individual research records your team can annotate and track through investor meetings. HubSpot receives the ten data points as marketing intelligence records tagged to your investor relations pipeline.
For the pitch preparation workflow, a rehearsal brief is drafted to Gmail with the ten most likely investor follow-up questions for each data point and suggested response notes. Granola records and transcribes your pitch practice sessions against the data points brief so you can review which statistics you cited fluently and which you hesitated on. Fathom tracks the meeting where you present the deck and timestamps which slides generated the most investor questions. Amplitude receives structured events for each investor interaction with the deck so you can correlate which data points drive the most follow-up meeting conversions. A Slack digest with the full data points brief posts to your investor relations and pitch team channels before the meeting.
Re-run the day before each meeting to catch updated figures: Edtech market data moves. Crunchbase funding figures update as new rounds close. HolonIQ publishes quarterly updates. Configure Barie to run a 24-hour pre-meeting refresh of the Crunchbase and Ahrefs data and compare against the existing Notion brief. If any figure has updated materially, the deck footnote and the Airtable record update automatically. You present the most current data in every meeting without re-doing the research.
What you get
Ten high-impact edtech market data points sourced from HolonIQ, Crunchbase, UNESCO, European Commission, Ahrefs, Deloitte, MIT EdTech Lab, and the US Department of Education — all retrieved live at query time with publication dates confirmed. A 12-slide investor-ready presentation deck in Google Slides with every statistic visualised and source-attributed in the footer. A full research brief distributed to Notion, Airtable, HubSpot, Gmail, Granola, Amplitude, and Slack. A rehearsal brief in Gmail with likely investor follow-up questions for each data point. Configured for 24-hour pre-meeting data refreshes. Zero statistics from training memory. Zero invented numbers.
What would take a founder a Saturday of searching and a Sunday of PowerPoint, Barie delivers before lunch on Friday.
The Verdict
Investors in edtech have read the 2020 HolonIQ estimates that circulate across the internet. They have seen the same infographic repurposed in dozens of decks. What they have not seen is a founder who presents a statistic and can immediately tell them which analyst firm published it, in which report, in which month. That level of specificity signals that the founder has done the research rather than assembled the deck. Barie retrieves from the primary sources, dates every data point, and generates the deck with source attribution in the footer of each slide. The investor who asks where a number came from gets the same answer they would get from an analyst who had spent a week in the primary literature. That is the research standard that distinguishes a first meeting from a second one.
Barie features used in this task