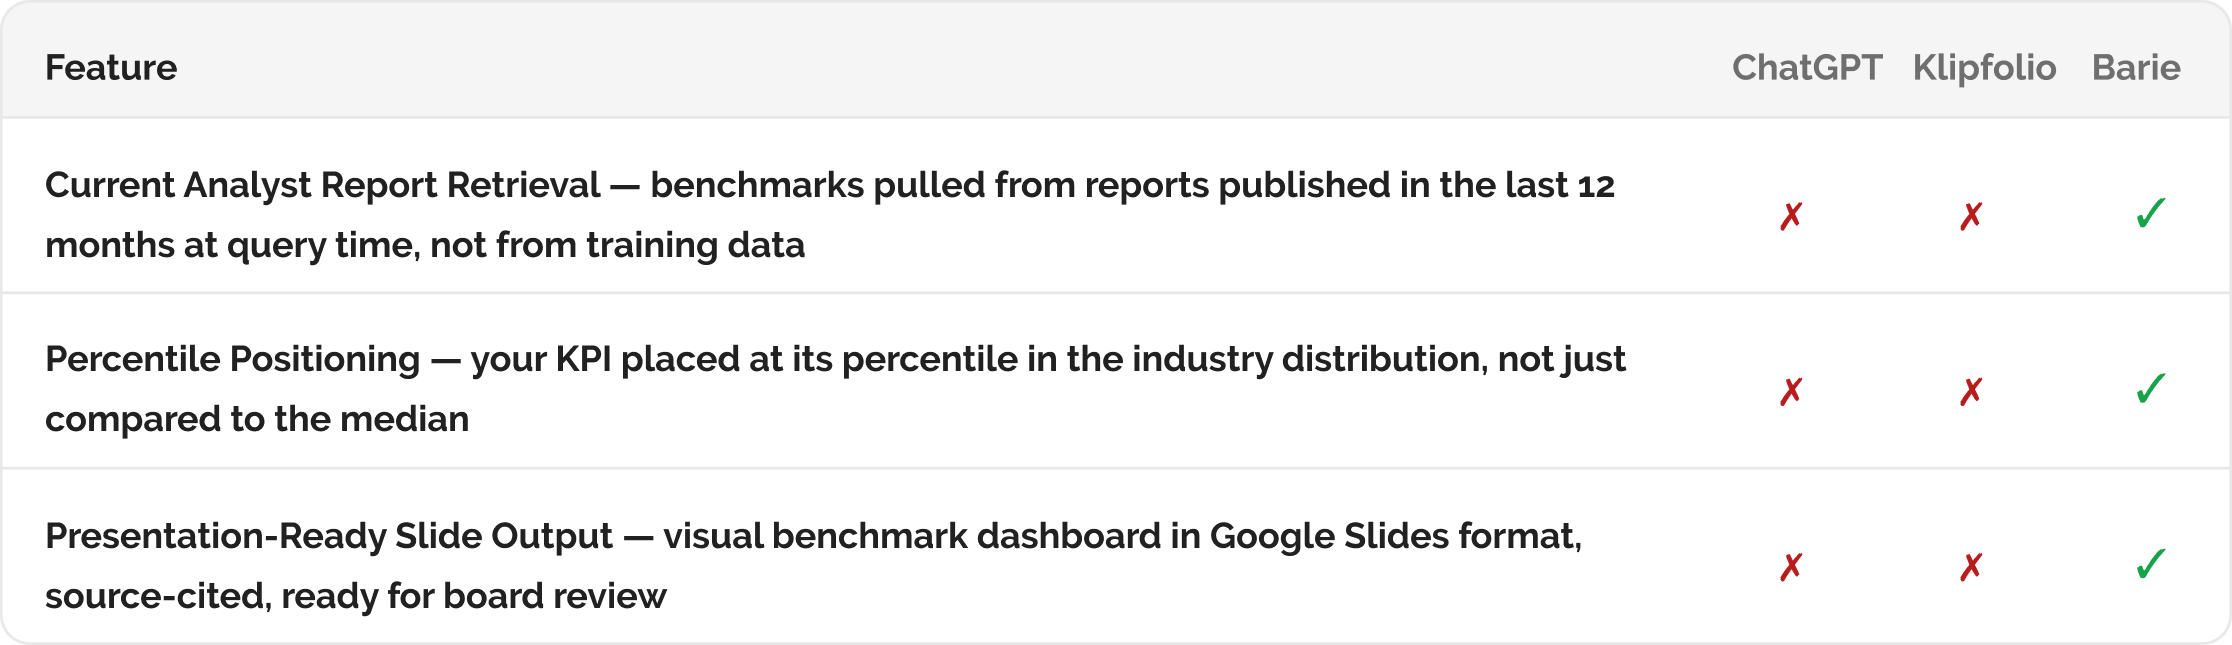
How Barie builds a KPI dashboard comparing your metrics against industry benchmarks — sourced from current analyst reports and public company data
Barie researches live industry benchmark data from analyst reports, SaaS survey databases, and public company disclosures. It builds a visual KPI comparison dashboard showing where you stand against current industry benchmarks for each metric — every benchmark traceable to its source, every comparison presentation-ready.
Why KPI benchmarks from industry reports become stale within months and mislead strategic decisions
A SaaS CFO builds a board presentation comparing the company’s KPIs against industry benchmarks she pulled from a Bessemer report published 18 months ago. The report was authoritative when published. In the intervening 18 months, the market correction changed the median net revenue retention benchmark, the average CAC payback period shifted significantly as sales cycles lengthened across the category, and what was considered a strong gross margin for a vertical SaaS company in 2023 is now the baseline expectation. The board presentation shows the company performing well against benchmarks that no longer represent the current market environment.
Benchmark data has a short shelf life in SaaS markets that move quickly. Barie retrieves current benchmark data — from the most recently published OpenView SaaS benchmarks, Bessemer reports, ChartMogul SaaS metrics reports, and public company SEC filings — at query time. The comparison reflects where the industry stands today, not 18 months ago.
Every benchmark in the dashboard is sourced to a specific current publication with a date: The NRR benchmark in the output cites the specific OpenView or Bessemer report it came from, with the publication date. The board can verify any figure. And when you run the analysis again next quarter, Barie retrieves updated benchmarks automatically — the dashboard is not a static slide, it is a reproducible analysis from current sources.
Your prompt
Task prompt
“Build a dashboard comparing our KPIs against industry benchmarks, sourced from current industry reports.”
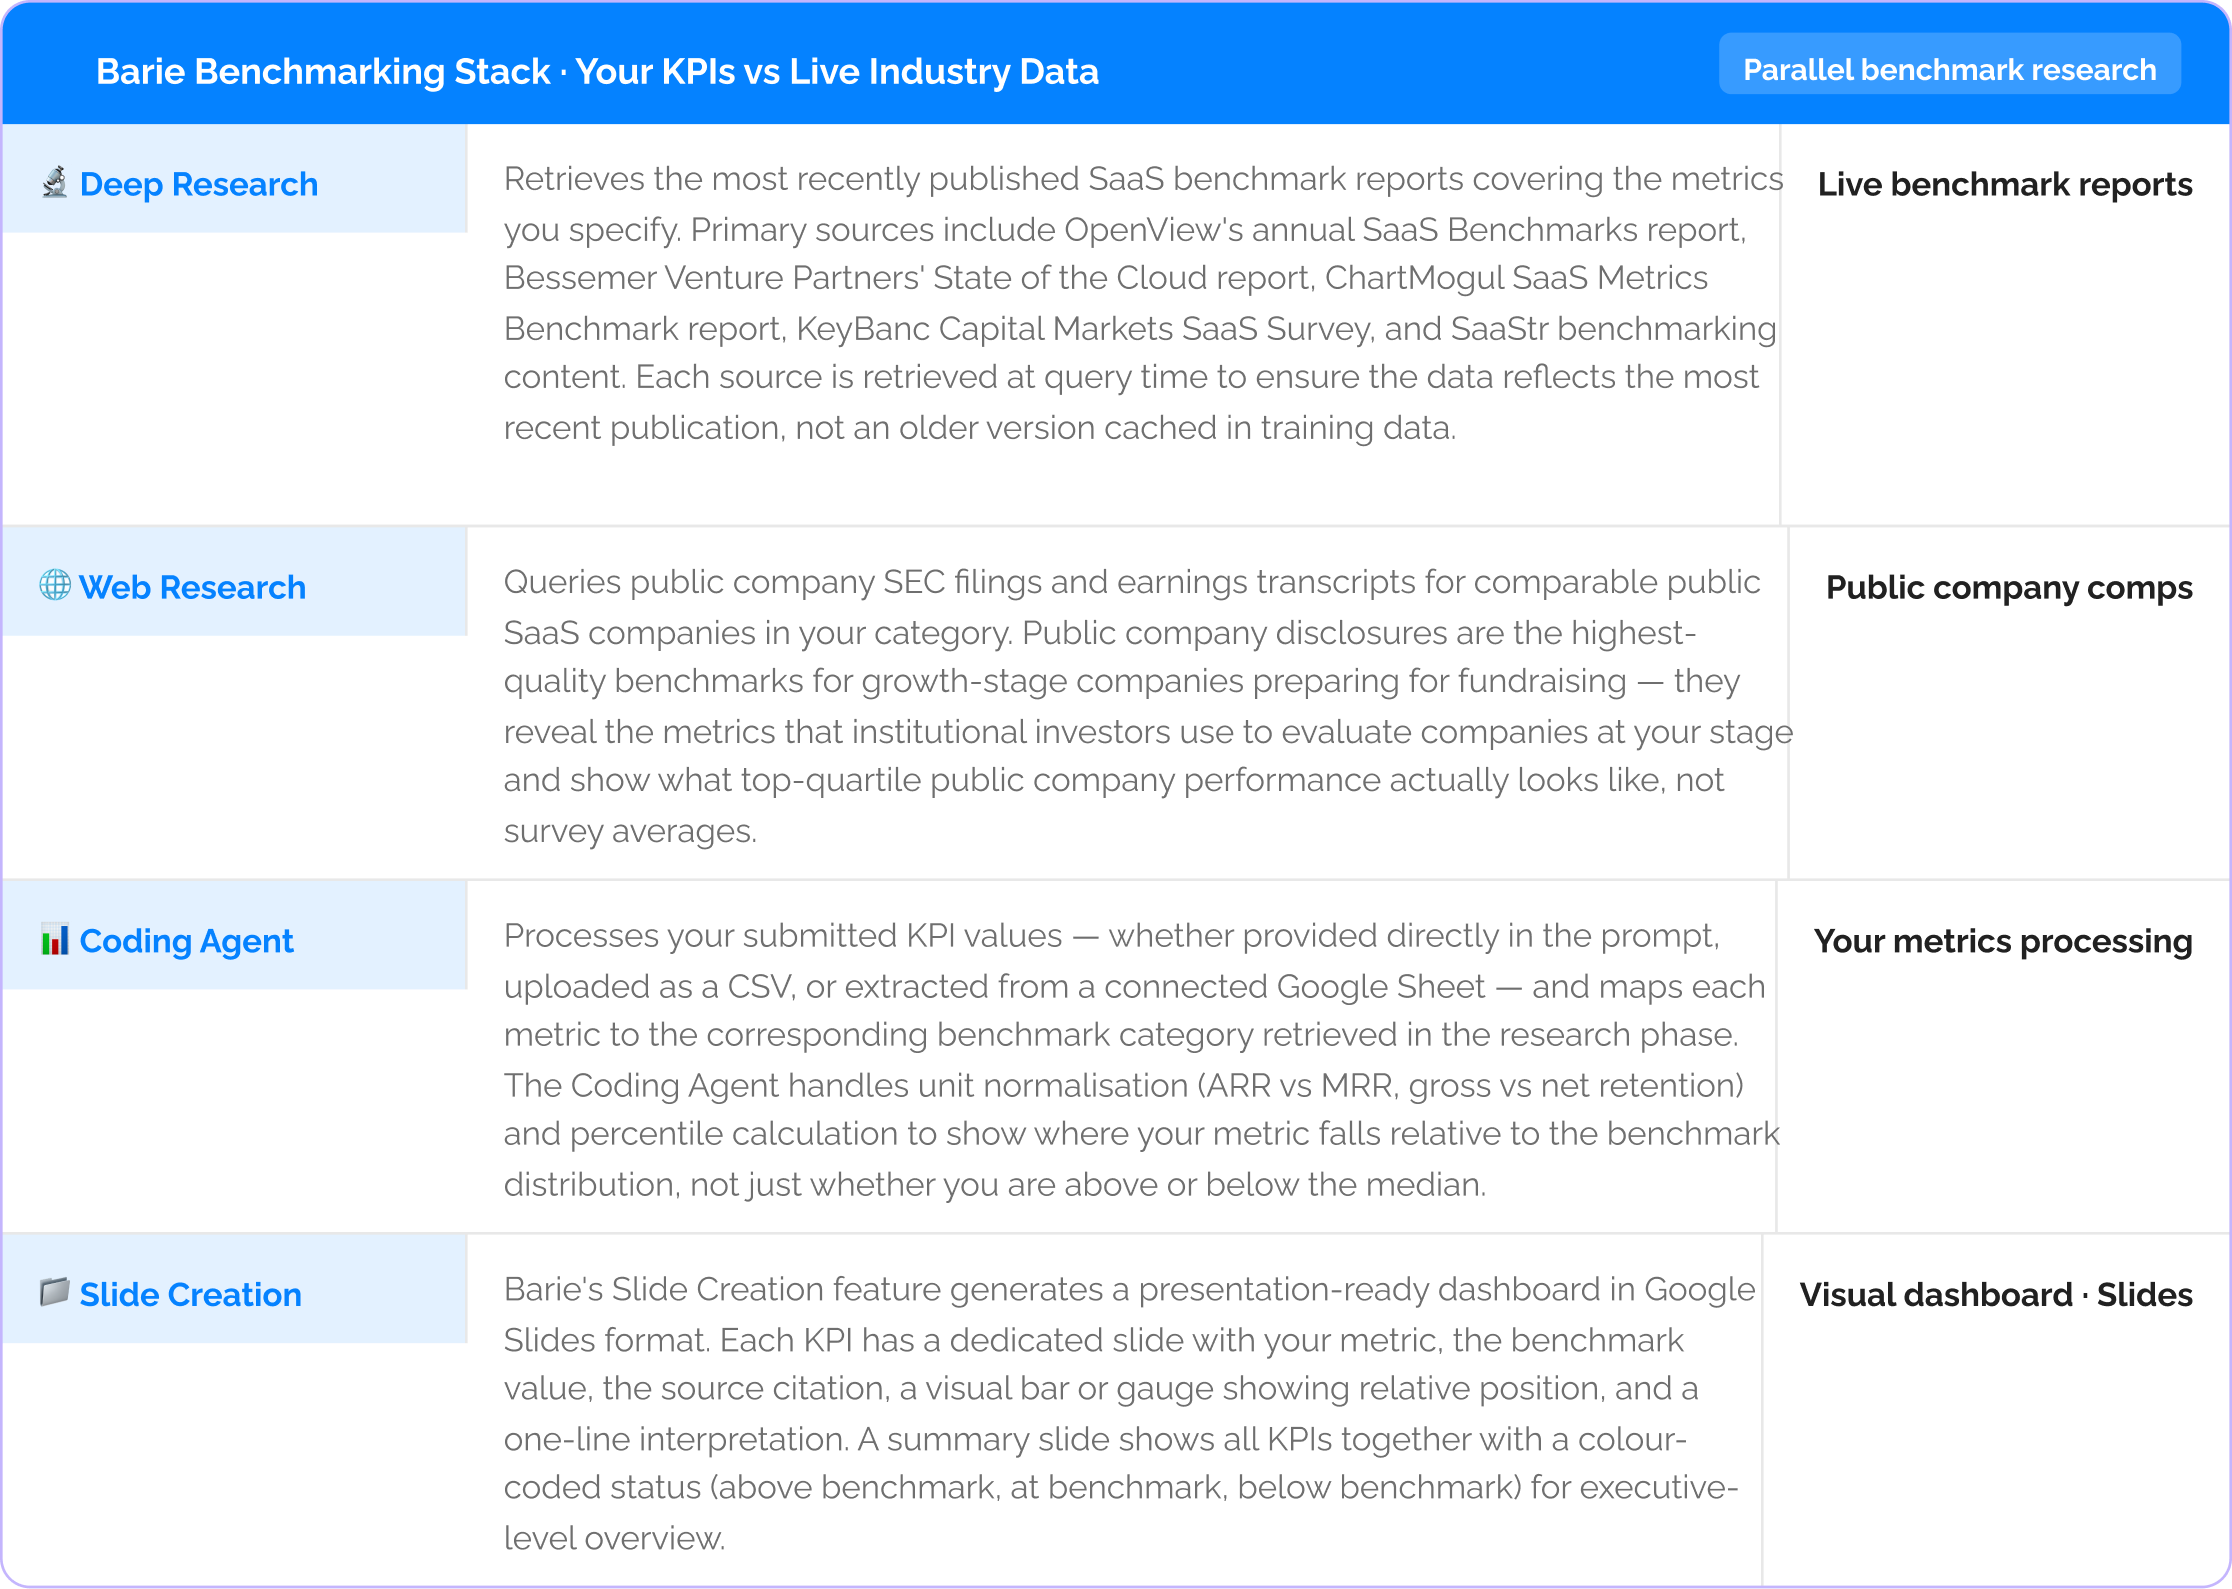
1: Four Connectors Activated
Step 1: Four connectors activated — your metrics input, live benchmark research, and visual dashboard generation
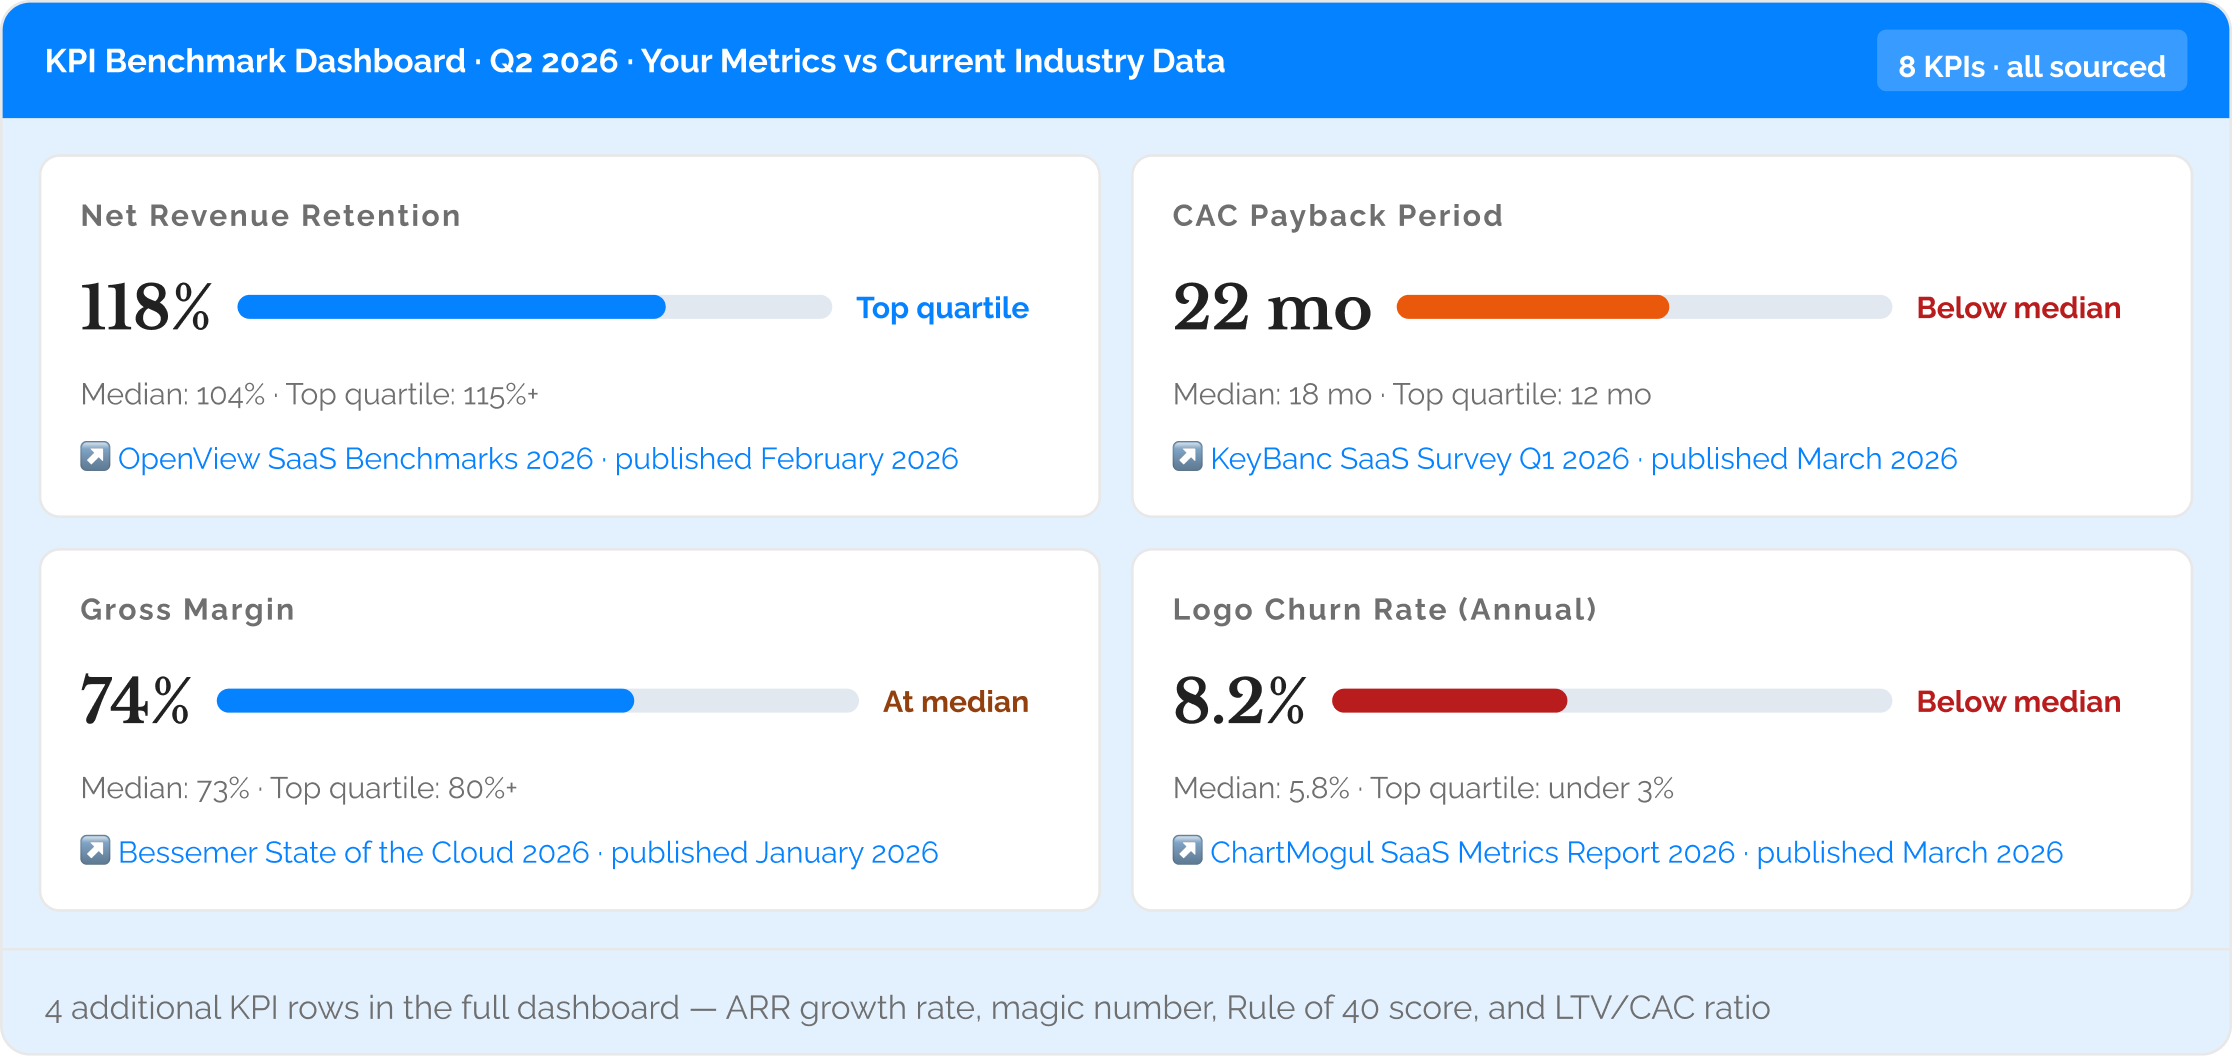
2: KPI Benchmark Dashboard — Sample Metrics
Step 2: The benchmark dashboard — your KPIs vs current industry benchmarks, every figure sourced

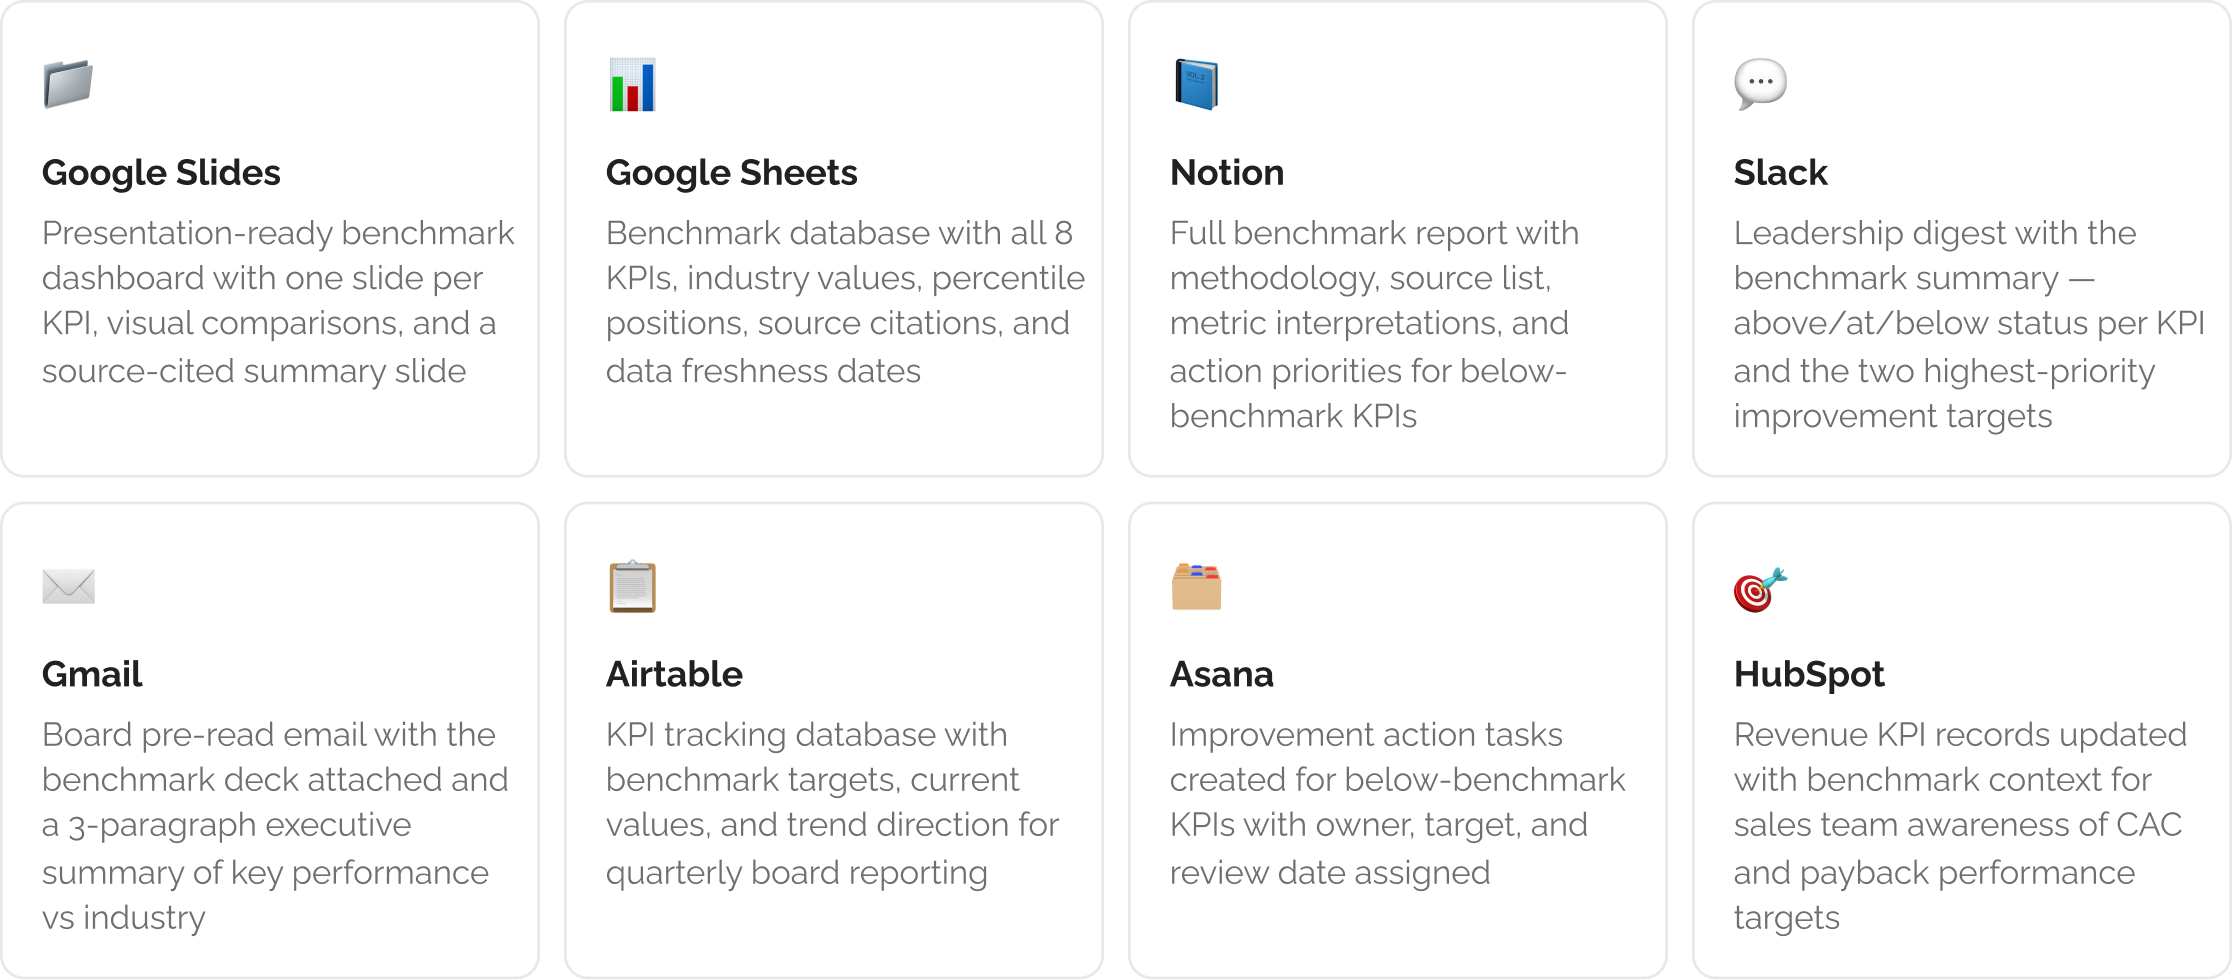
3: Delivered to Leadership and Analytics Tools
Step 3: The benchmark dashboard delivered to your reporting and presentation tools
The Verdict
A benchmark comparison built from an 18-month-old analyst report tells the board how you are performing against the market as it was, not as it is. The median CAC payback period, the NRR benchmark for top-quartile SaaS companies, and the gross margin expectations for vertical SaaS have all shifted meaningfully since any report published before 2025. Barie retrieves the benchmarks from reports published in the last 12 months at query time. The comparison is against the current market, presented in a source-cited dashboard the board can verify. Every benchmark has a publication date. The CAC payback concern in the output is not against a 2023 standard. It is against what institutional investors evaluating SaaS companies in early 2026 are using as their reference.
Barie features used in this task