
Many AI tools for checking stocks give you the basics: the price, how much it’s traded, and some simple numbers. That’s a decent start, but often, investors want to know more, to truly understand a company. Barie.ai tries to fill that gap. It offers insights that go deeper, all presented in a clear and easy-to-use way. Let’s look at some key differences.
1: Digging Deeper: What the Numbers Really Mean
What most AI tools show you:
Usually, these tools stick to common numbers like P/E (price-to-earnings) and EPS (earnings per share). You’ll get a general idea of the company and recent news. But they often miss out on the bigger picture, like how the stock has performed over many years, or how its value compares to similar companies. It’s helpful, but it’s more of a quick peek than a full understanding.
What Barie.ai does differently:
Barie.ai pulls out over 30 financial details. This includes things like EV/EBITDA (Enterprise Value to Earnings Before Interest, Taxes, Depreciation, and Amortization), how much profit the company makes from sales, and how much cash it generates. It also shows you how these numbers have changed over time. More importantly, it doesn’t just show you the numbers; it helps you see a company’s value by comparing it to its competitors and looking at its own past. It even tries to explain why a company might be valued higher than others. It’s about getting the full story, not just a few facts.
2. Beyond Simple Charts: Understanding Market Moves
The usual way:
When it comes to looking at stock charts, you’ll typically see lines for moving averages or trading volume. These are good for showing trends. The challenge is, figuring out what these trends mean – like when to buy or sell – is completely up to you.
Barie.ai’s helpful twist:
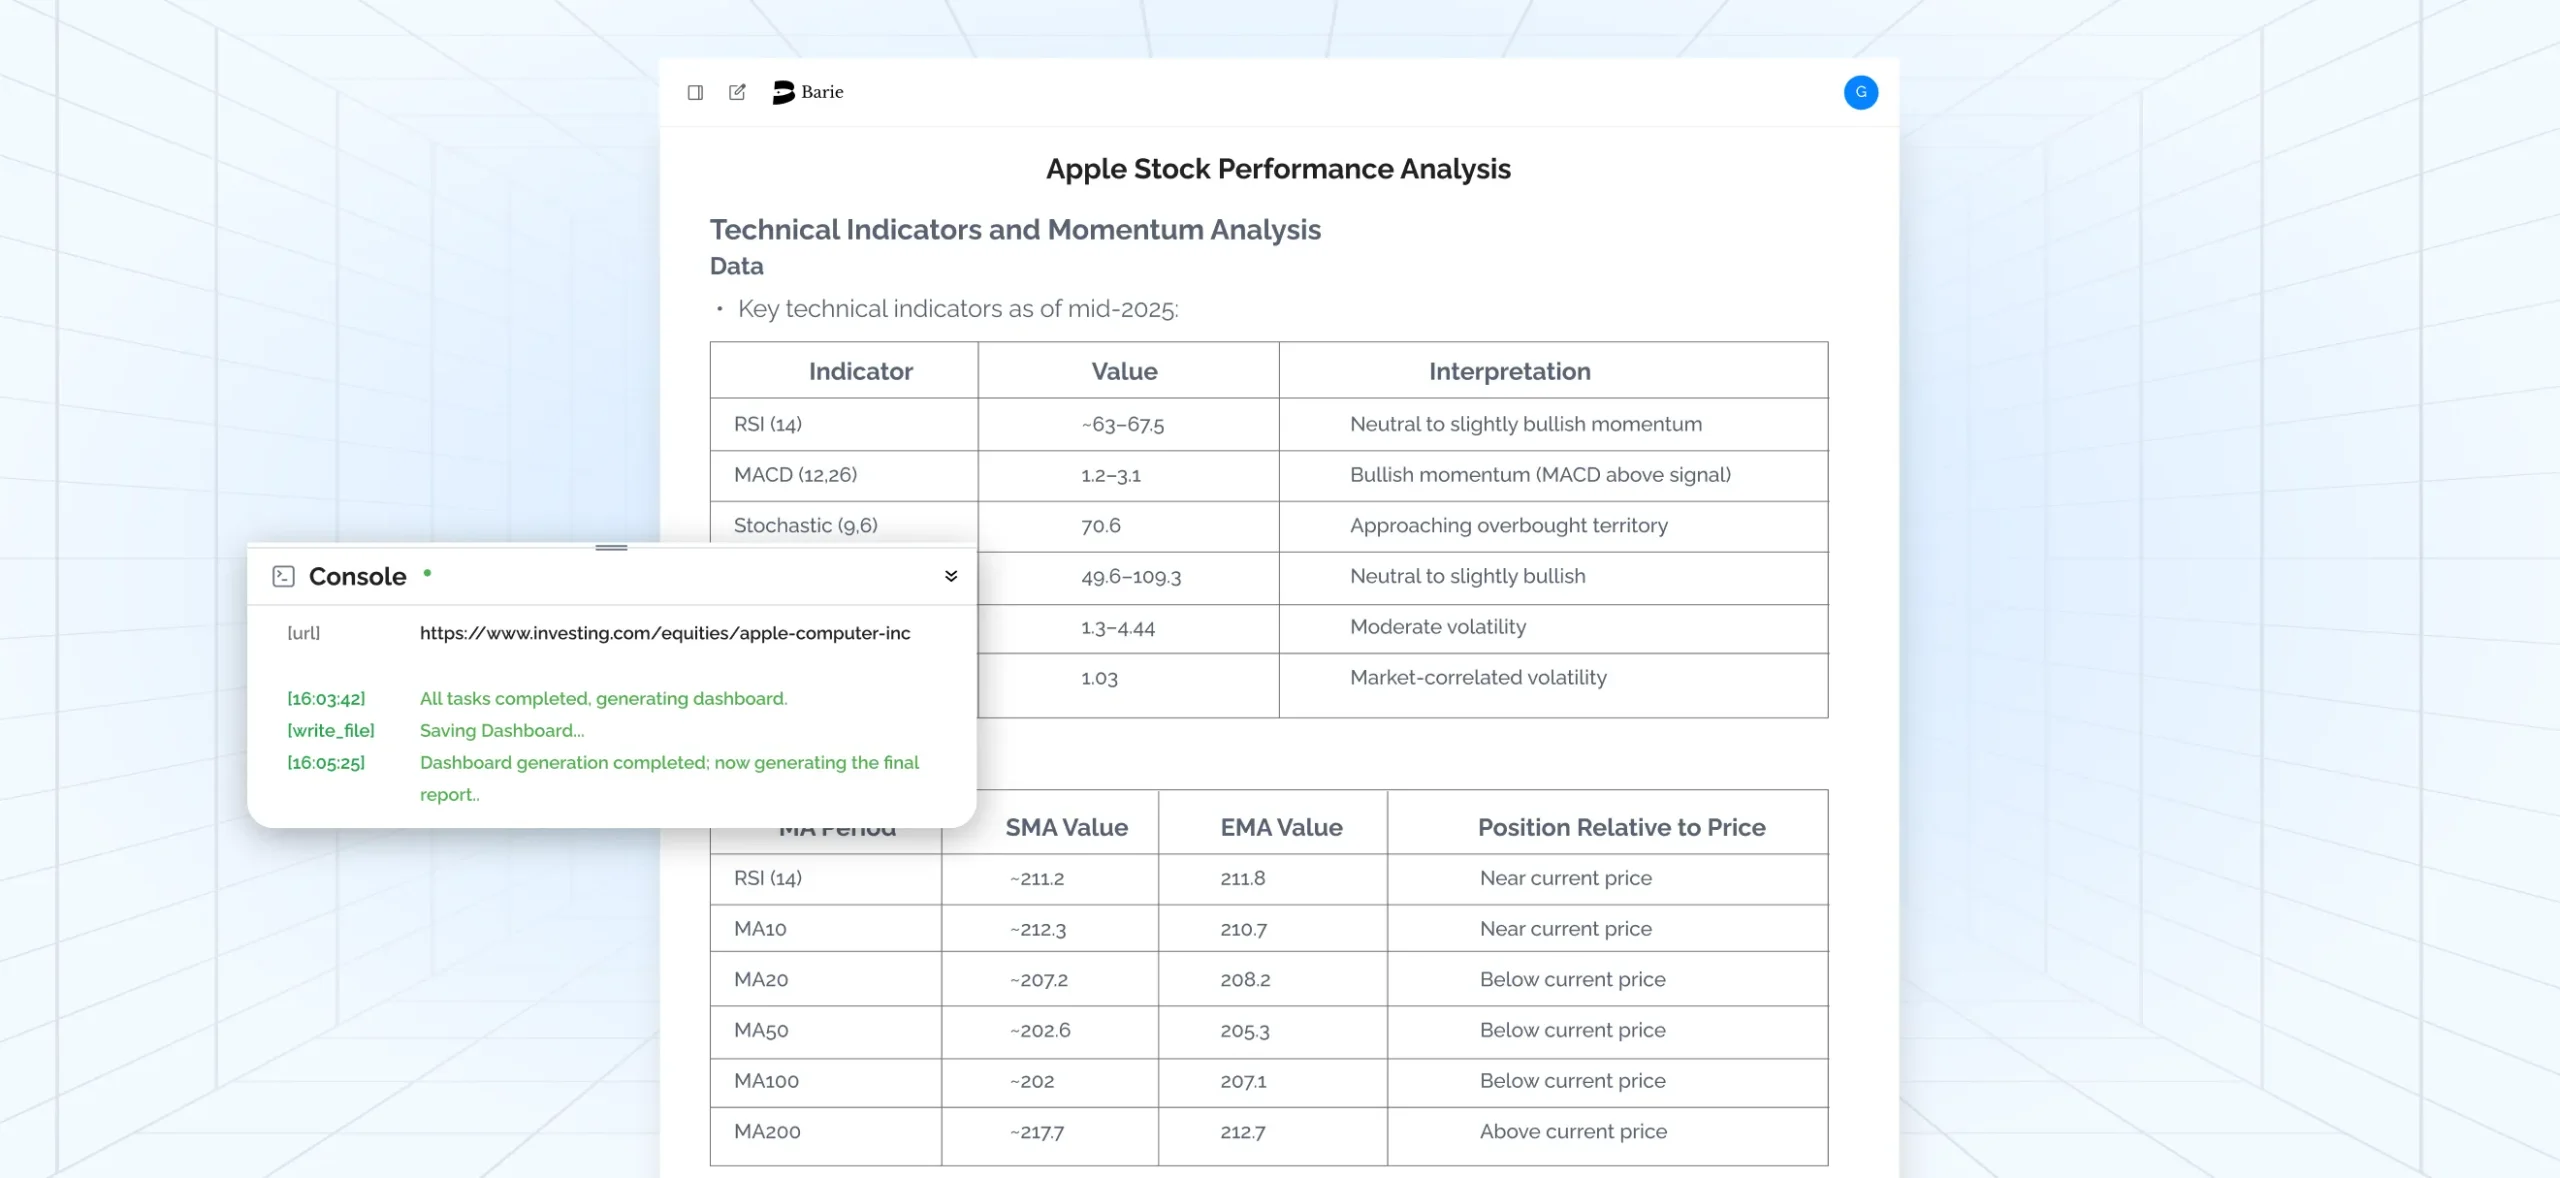
Barie.ai aims to guide you more. It helps make sense of key chart indicators such as RSI (Relative Strength Index), MACD (Moving Average Convergence Divergence), and important support and resistance levels. It can even point out possible times to buy or sell, for example, suggesting you “wait for the stock to break above its 200-day moving average.” This turns raw chart data into more actionable ideas.
3. Looking Closer: Company Health and Risks
What standard tools often do:
Many tools just repeat public descriptions of companies and news headlines. They might list what analysts think, but they usually don’t explain why analysts feel that way or give you deeper reasons behind their recommendations. It can feel like you’re only getting half the story.
How Barie.ai tries for a fuller picture:
Barie.ai looks at more than just the numbers. It considers things like the company’s leaders, how new and exciting their products are, their ESG (Environmental, Social, and Governance) standing, and even how strong their brand is. Importantly, it also flags possible dangers, such as government rules that might affect the company or issues with its debt. On top of that, it talks about what analysts are thinking, but with more context: what’s driving their opinions, and have their stock price targets changed recently? It’s about getting a well-rounded view.
4. From Info to Action: Clear Next Steps
The common ending:
Many traditional stock tools simply end their report with a general “buy,” “sell,” or “hold.” While direct, this often leaves you wondering what to do next.
Barie.ai’s goal for practical advice:
Barie.ai aims to offer more specific suggestions, including:
- Best times to buy: Where might it make sense to buy, based on both the company’s value and how the market is moving?
- Risk points: What price levels or outside events might mean you should rethink your investment?
- Timeframes: Is this an investment for the short-term, a few months, or for many years?
- And importantly, a short reason explaining each suggestion.
This level of detail is designed to help you make more confident choices.
5. Easy to Understand: How Information is Presented
The typical jumble:
Sometimes, information and findings from these tools can be presented in a messy way, making it hard to find what you’re looking for. It’s not always easy to read.
Barie.ai’s focus on clarity:
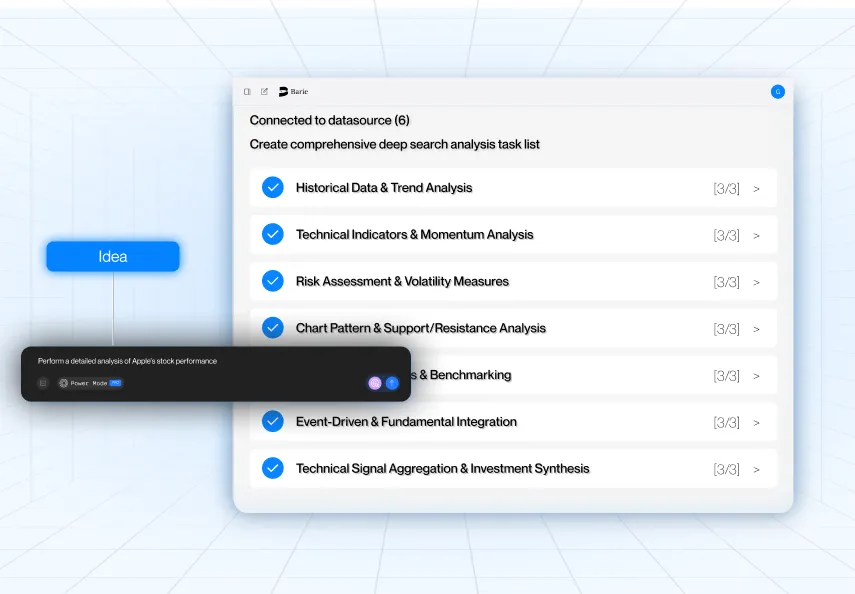
Barie.ai organizes its analysis into clear sections. You get a quick summary at the start, followed by dedicated parts for company basics (fundamentals), market trends (technicals), company health and risks, and a clear action plan. It uses charts, tables, and bullet points to help tell the story, making it easier and quicker to understand the information.
A More Thoughtful Way to Analyze Stocks
Barie.ai isn’t just about showing you data; it’s designed to give you deeper insights, present them clearly, and offer practical thinking in a well-organized analysis. If you like a logical, step-by-step overview that connects what’s happening in the market with clear guidance, Barie.ai might offer a more thoughtful approach to your stock research, cutting out the unnecessary fluff.